|
RELATIVITY SPECIAL
RELATIVITY
MINKOWSKI
SPACETIME DIAGRAMS
Ian Cooper matlabvisualphysics@gmail.com DOWNLOAD DIRECTORY
FOR MATLAB SCRIPTS GR_001.m Minkowski spacetime diagrams This article will examine how the Minkowski spacetime diagram
can be used to enhance the study of the special relativity. A
Minkowski spacetime diagram
is a geometric representation of motions in spacetime. The vertical
axis is usually plotted as the time axis. Any point in spacetime is called a world-point, and
a series of world-points representing the motion of some object is called a worldline. Any
individual event is uniquely represented by some point B. The description of
this event is
described in the O frame by the coordinates (x, ct) and in the O’ frame by the
coordinates (x', ct').
The origins of O and O' are chosen so as to coincide at ct = ct' = 0, and
the relation between (x,
ct) and (x', ct')
is contained in the Lorentz transformations. The worldline of a light signal starting
out at x = 0, ct = 0, is a bisector
of the angle between the axes. This holds good in both the
O and O' frames. The starting point is the Lorentz
transformations between the
inertial reference frames (IRF) O (observer Steve) and O’
(observer Mary) where the IRF O’ is moving in the + x
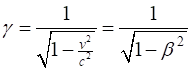
direction with uniform velocity v. The velocity v will be expressed
by the factor (1)
and the Lorentz factor
(2) Spacetime coordinates:
O (Steve) Lorentz transformations:
(3)
Coordinate axes:
O (Steve) x-axis ct =
0 and ct-axis x = 0
Cartesian axes
O’ (Mary) x’-axis
Angle between x-axis and x’-axis
Angle between ct-axis and ct’-axis
The coordinate
axes are referred to as worldlines. Light cone: Light
on a Minkowski diagram will always travel at 45o
to the time axis along the surfaces of a 45o cone, which is called
the light-cone (figure 11). Spacetime
interval, an invariant
quantity called the Lorentz invariant:
The units for
all axes are metres [m]. The ct and ct’ axes give the distance that light would travel
in times t and t’. respectively. For example,
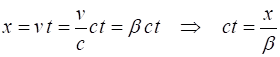
a 1.0 m interval corresponds to a time interval of (1/c) s. Steve observers
Mary travelling a constant velocity v in the direction of the +
x-axis. Therefore, the displacement of Mary w.r.t.
Steve is
Hence, Steve
observes Mary travelling along the ct’
worldline. A point defines
an event that occurs at a
particular place at a particular instant in time. The Minkowski spacetime diagrams shown represent a model of two spacetime
events, event A (green dot) and event B (red
dot). Two observers in two inertial reference frames pass each other
at the Origin, this being the event A (green dot).
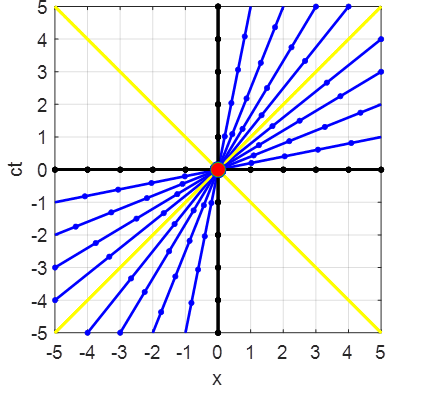
In the input section of the Script GM_001.m, the value of
Fig. 1. The yellow lines at 45o
shows the light-cone worldlines for Figure 2 shows
the change in worldlines as
Fig. 2. Change in worldlines as The Minkowski diagrams show the events as
measured by the two observers as designed by Einstein - each observer has a
set of synchronized clocks and previously established distance points. The
time measurements for event B are what
the synchronized clocks would display and so the observed times do not take
into account the travel time of light from the events to the observers. One
observer (Steve) follows the worldline of ct,
the other (Mary) follows a worldline ct'. Time intervals between event (temporal order) and simultaneity The two observers agree that event A
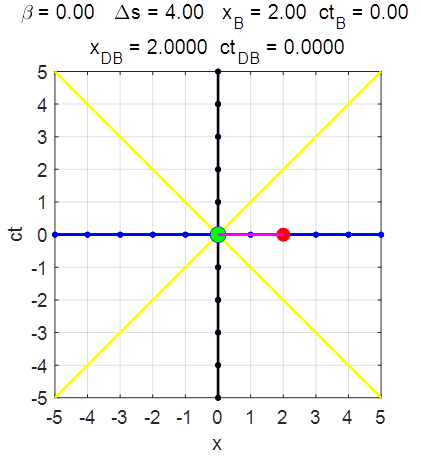
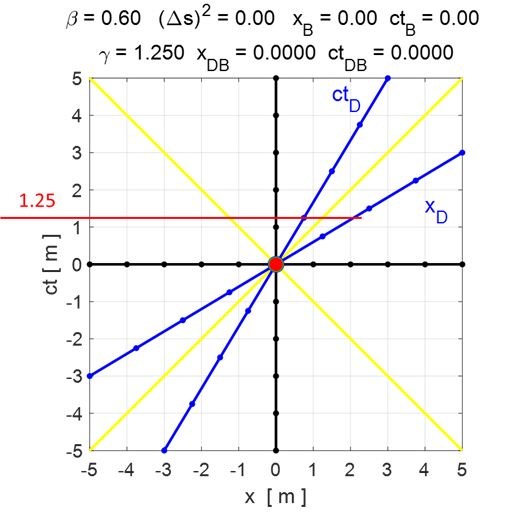
occurred when both their clocks recorded 0 The two events A and B are simultaneous in both reference frames when
their relative velocity is zero
Fig. 3. When v = 0 the two events A
and B occur simultaneous in both IRFs. When there is relative motion between the two IRFs
Fig. 4. Events A
and B are simultaneous in O but
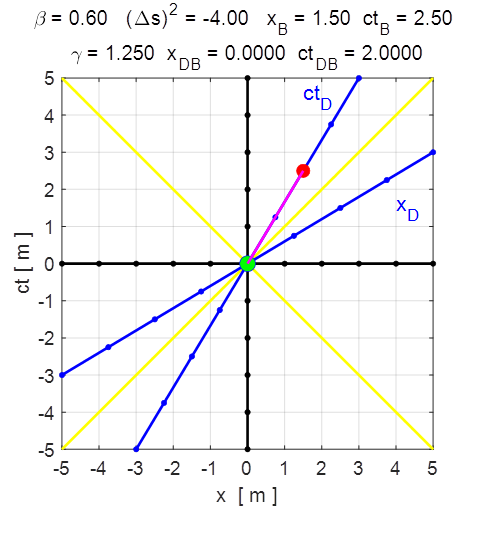
not in O’. With input
values ct’ = 0 (ctBD
= 0) and x’ = 2 (xBD
= 2) as shown in figure 5, event B is
now simultaneous to event A in the
reference frame of the moving observer O’, but not in the
non-moving reference frame O, where event B
happens 1.50 time units after event A. Notice that event B is placed on the axis x' (ct’
= 0). All points on this axis are simultaneous to the origin in the moving
reference frame. Likewise: all points on any line that is parallel to x'
are equidistant in time from the Origin in this reference frame.
Fig. 5. Events A
and B are simultaneous in O’
but not in O. Time dilation effect
and the slowing of moving clocks For an observer
in an inertial frame of reference, a clock that is moving relative to them
will be measured to tick slower than a clock that is at rest in their frame
of reference. This phenomenon is called the special
relativistic time dilation effect. The faster the relative
velocity, the greater the time dilation between one another, with time
slowing to a stop as one approaches the speed of light. The equation for time
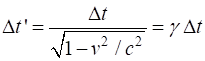
dilation is (4)
which expresses
the fact that the moving observer's period of the clock
Fig. 6. The moving clock of Mary as observed
by Steve runs slower. Mary’s clock has advanced 1.00 units of time
while Steve’s clock has advanced 1.25 units of time Input values
for figure 7:
Fig. 7. The event B occurs on the worldline ct’
for O’ and thus ctDB
is the proper time and ctB is the
dilated time in O. Input values
for figure 8:
Fig. 8. The event B occurs on the worldline ct
for O and thus ctB is the
proper time and ctDB is the
dilated time in O’. Both observers will conclude that the other clock
is slow by a factor of Lorentz-Fitzgerald
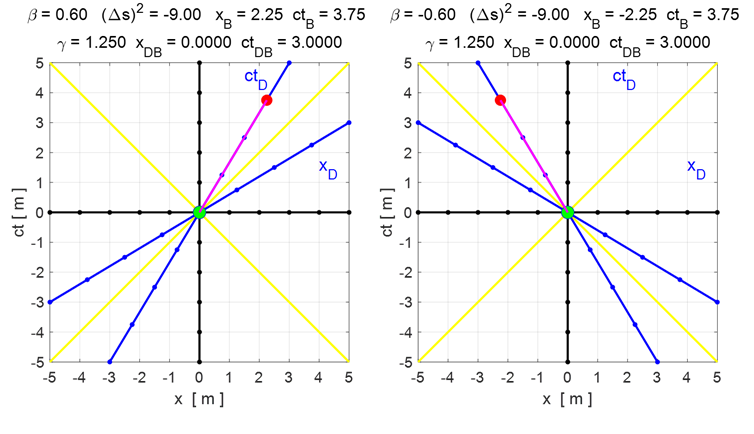
Length Contraction The
length of any object in a moving frame will appear foreshortened (contracted)
in the direction of motion. The length L0 is maximum in the
frame in which the object is at rest (proper
length) and the length L observed is in the moving frame is
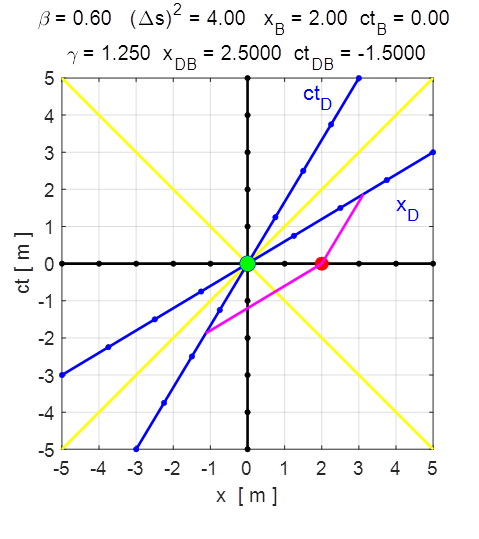
the contracted length. The equation for the contraction in length is (5) Example: Length
contraction increases more rapidly with increasing velocity and also the
length contraction becomes extreme when v approaches c. The
use of a Minkowski diagram to calculate and show
the Lorentz-Fitzgerald length contraction requires some special
consideration. Suppose we have an object of length 2 units. How can this
length be measured? In the non-moving IRF there is no problem, since the
object is not moving it is easy to make the length measurement along the
x-axis, since we know that all points on this x-axis are simultaneous in the
non-moving IRF. In the moving IRF the length measurement needs to be made by
making measurements simultaneous at both ends of the object. That is only
possible along the x' axis or a line parallel to this x’-axis. We know
that all points on the x’-axis are simultaneous for the moving
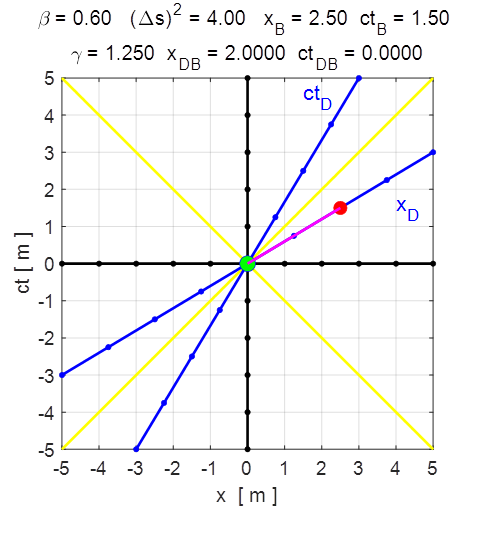
observer. Figures 9 and 10 show
simulations for length contraction.
Fig.
9. Inputs:
Outputs: proper length xB = 2.50 in O and contracted
length xDB = 2.00 in O’.
Fig.
10. Inputs:
Outputs: proper length xDB = 2.50 in O’ and
contracted length xB = 2.00 in O. Both
observers in the two IRF would conclude that length is contracted in the
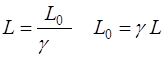
direction of motion. Twin
Paradox The
twin paradox is the well-known fact that someone travelling at a relativistic
speed, ages more slowly than someone at rest. This can be demonstrated by an
experiment with a pair of twins where one twin travels an interstellar
distance and back at high speed. Let
event A1 be the separation of the twins and event A2 the reunion at the
Origin. These events are both on the ct worldline
of the twin that stays at home at rest. Event B is the turn around point for
the travelling twin, and this event must therefore be on the ct' worldline. Outward
journey Inputs:
Outputs: For
the return journey, the travelling twin turns around, therefore the velocity
and displacement must be negative
Inputs:
Outputs:
Fig.
11. Total elapsed time for the travelling twin is thus 6.0 a.u. while for the stay-at-home twin, the total elapsed
time is 7.5 a.u. (3.75 + 3.75). Hence,
we can conclusion that the travelling twin ages slower! This is of course not
really a paradox, since the stay-at-home twin is staying in the same inertial
reference frame but the travelling twin is switching reference frame at the
turn around point. This can also be seen from the fact that the worldline ct of the stay-at-home-twin is continuous (vertical) but
the travelling twin has two different ct’
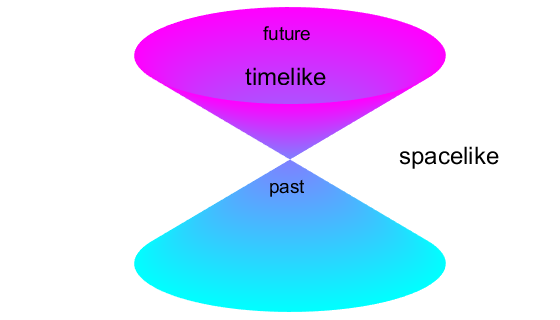
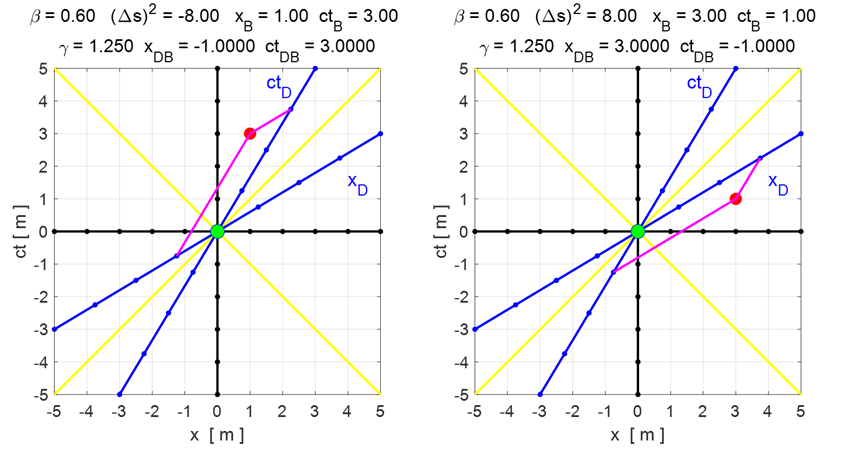
worldlines. Timelike
and spacelike intervals The
Minkowski spacetime diagram is divided into four
equal sectors by the two lightlines. Two sectors
are timelike and the other two sectors are
spacelike (figure 12). The two lightlines occur
when the spacetime interval is zeros,
Fig.
11. Timelike and spacelight
sectors. If
event B occurs in a timelike
sector than the spacetime interval is negative, If
event B occurs in a spacelike sector
than the spacetime interval is positive,
Fig.
12. Timelike
(left) and Spacelike (right). Spacetime
interval contours We
can plot lines of constant spacetime intervals on a Minkowski
spacetime diagram. The contours shown in figure 13 are:
Fig.
13. Spacetime interval
contours: invariant hyperbolae It
is not possible to define ‘space’ uniquely since different
observers identify different sets of events to be simultaneous. But, there is still a distinction between space and time,
since temporal increments enter References Many
of my examples were based upon the article: http://www.trell.org/div/minkowski.html |