|
MATLAB
RESOURCES FOR INTRODUCTION
TO QUANTUM MECHANICS
3rd
Edition
David
J Griffiths & Darrel F Schroeter
Ian
Cooper matlabvisualphysics@gmail.com CHAPTER 1 THE WAVEFUNCTION STATISTICAL INTERPRETATION WAVE PARTICLE DUALITY DOWNLOAD DIRECTORY FOR MATLAB SCRIPTS diffraction_1slit.m Simulation
of the diffraction of visible light through a single slit. diffraction_2slit.m Simulation
of the diffraction of visible light through a double slit. diffraction_particle.m Animation
of the diffraction of a stream of particles passing through a double slit. ColorCode.m Returns
the color appropriate to a supplied wavelength. Is
it assumed the supplied lambda is within the range 380-780 nm. Smaller or
higher values are set notionally to the extreme values. All input
measurements are in metres. interference.m
interference1.m Simulation
of the interference pattern of water waves passing through a pair of slits. Are
electrons particles or waves ?
LIGHT BEHAVING AS
WAVES When
light passes through very narrow apertures and falls on a screen, a
diffraction / interference pattern consisting of a band of bright and dark
regions is observed. The brightness (intensity) of light detected on the
screen is proportional to the square of the amplitude of the wave. For a
plane wave incident upon an aperture, we observe Fraunhofer diffraction when
the screen distance is much larger than the width of the apertures. The
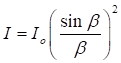
intensity of light reaching the screen for a single slit is given by the equation (1) where I intensity
of the light [W.m-2] Io maximum
intensity [W.m-2] k b slit
width [m] x position
of screen [m] D aperture
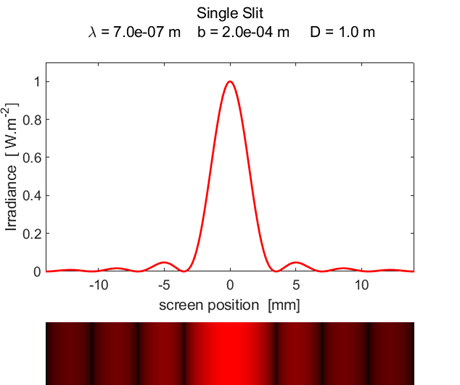
screen distance [m] The
script diffraction_1slit.m can
be used to show the diffraction pattern for a single aperture. The graphical
output of the Script (figure 1) shows a graph of the intensity calculated by
equation 1 and a two dimensional plot showing the
bright and dark bands that would be observed. The wavelength (380 – 780
nm) and width of the aperture can be changed in the Script to observe the
changes in the diffraction pattern. The script diffraction_1slit.m calls the function ColorCode.m so the color of the display corresponds to the color associated with the wavelength of the light. The
maximum intensity has been normalized to 1 W.m-2.
Fig. 1. Fraunhofer diffraction from a
single slit. diffraction_1slit.m The
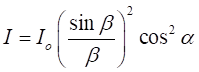
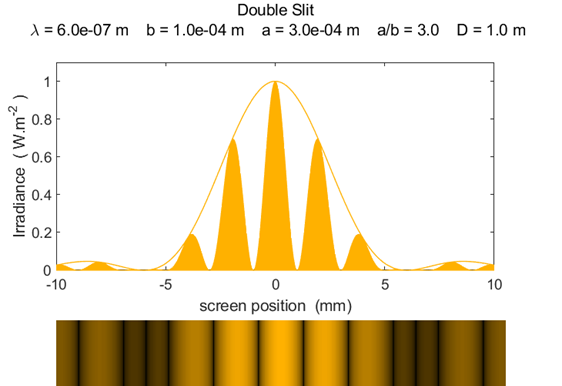
intensity of light reaching the screen from a double slit is given by the equation (2) where
slit separation a [m] Figure 2
shows the graphical output for a double slit using the Script diffraction_2slit.m. In the Script,
you can vary the wavelength, slit width and slit separation and observe the
resulting changes in the diffraction pattern. The maximum intensity has been
normalized to 1 W.m-2.
Fig.
2. Fraunhofer diffraction from a
double slit ( PARTICLES BEHAVING
AS WAVES Waves
are a mechanism for transferring energy via some kind of vibration without
any matter being transferred. One characteristic of waves but not of
particles, is that, diffraction / interference is observed as shown in
figures 1 and 2 when a wave passes through an aperture. However, in
experimental arrangements analogous to the two slit
interference for light, when a beam of electrons is incident upon a biprism
(mimics two slits for light as the electrons can travel in two paths around a
filament) and are detected upon a screen, an interference pattern is
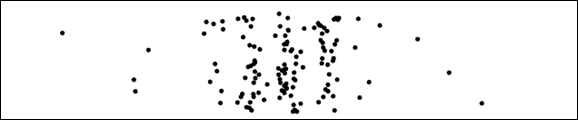
observed. When a few electrons hit the screen, no noticeable pattern is
discerned as shown in figure 3.
Fig.
3. Pattern formed by 2000
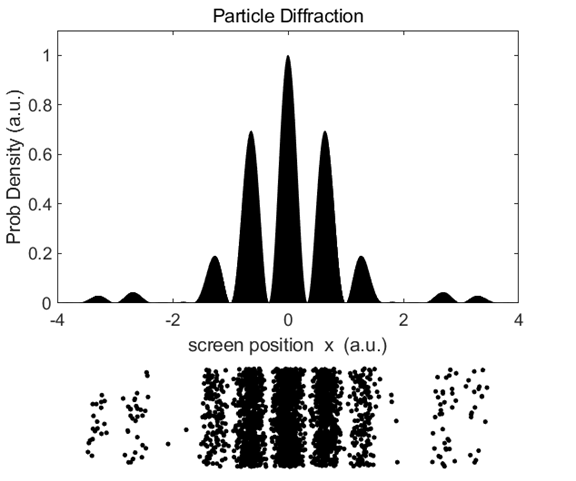
electrons on passing through the equivalent of a double slit. diffraction_particle.m However,
for much longer exposures involving 80000 plus electrons, a very distinctive
two slit diffraction pattern is clearly observed as shown in Figure (4). Running
the Script diffraction_particle.m
you can include a pause statement to animate the individual
electrons hitting the screen to show how the interference pattern develops.
Fig.
4. Pattern
formed by 80000 electrons on passing through the equivalent of a double slit.
As more and more electrons hit the screen a two slit interference pattern
develops. diffraction_particle.m The
electrons are individual particles when they strike a single point on the
detection screen, but the distribution of the points on the screen gives an
interference pattern which can only be attributed to a wave phenomenon.
Hence, we can only conclude that electrons have this dual nature – they
behave as particles or as waves. We can’t predict where a single
electron will arrive on the screen. We only know the probability of where an
electron will strike. This behavior is typical of
the quantum world and is a good example of the interplay between
indeterminism and determinism. The
electron is represented by a mathematical function called the
wavefunction We can
now interpret the irradiance given by equation 2 as a probability density for
the electron striking the screen and the area under the curve being
proportional to the probability of finding the electron. For a
one-dimensional system, the probability of finding an electron between x1 and x2 at time t
is given by (3) and for
the two slit example, the probability of hitting a
pixel at position (x, y) on the detection screen at time t is (4) where A is the
area of the pixel. We
can’t predict where a particular electron will strike the screen but
the pattern formed by many electrons is predicted by the Schrodinger equation
which tells how For a
free particle (total energy E =
kinetic energy K, potential energy U = 0)
its wave nature is described by its de Broglie wavelength (5) where h is
Planck’s constant and p is the
momentum of the particle. Diffraction experiments confirm that the wavelength
given by equation 5 agrees with the wavelength as measured in these
experiments. Classical
waves and matter (particle) waves have very different characteristics.
Consider, for example, the interference pattern produced by water waves
passing through two slits. If one slit was blocked a cork floating on the
water would simply bob up and down. For the two slits, the movement of the
cork is the determined by the summation of the displacement of the two waves
emerging from the slits. Upon passing through the slits the waves spread out.
At some locations, the cork would move up and down with maximum displacement
due to the constructive interference of the two waves. At other places, the
cork would remain still as the two waves cancel each other (destructive
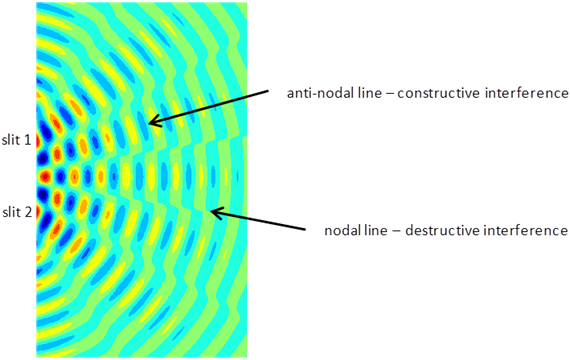
interference). Figure 5 shows a
typical interference pattern for two slits at one instant of time.
Fig. 5. Typical two slit
interference showing radiating lines for the nodes (destructive interference ) and antinodes (constructive interference). interference.m The
position of an electron is not known until it is measured. The electron does
not spread out like the wave producing the interference pattern. The complex
wavefunction gives a complete description of the electron. It is no longer
sensible to think about the electron as a moving particle. The
electrons propagate as waves (but not like classical waves) and are detected
as particles – they display wave-particle duality. https://stemjock.com/griffithsqm3e.htm |