|
PYTHON TUTORIAL X-Y PLOTS: PROJECTILE MOTION Ian Cooper matlabvisualphysics@gmail.com DOWNLOAD DIRECTORIES
FOR PYTHON CODE Graphs22.py This article provides information about using Python
for plotting X-Y graphs using the example of projectile motion. PROJECTILE
MOTION It is assumed that the acceleration in the
horizontal direction is zero and a constant in the vertical direction. To the
right is the +X direction and up is the +Y direction
where g is the
acceleration due to gravity. The initial displacement for the projectile
launch is given by x0
and y0. The initial launch velocity has a magnitude v0
and direction φ and
the velocity components are The
equations describing the motion are The
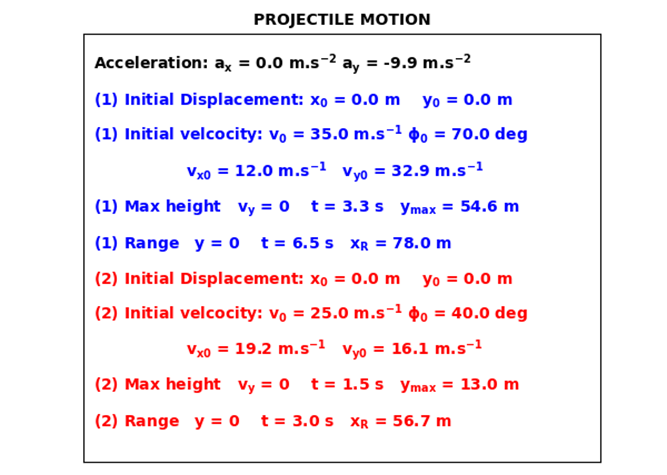
code Graphs22.py simulates the motion of two projectiles labelled 1 and 2. PYTHON A Figure
Window can be used to display the numerical values for the simulation input
and output variables. This is often more convenient than displaying the
values in the Console Window.
The motion of a projectile can be viewed graphically as shown
in the sequence of graphs. (1) Multiple plots
(2) Twin axes
(3) Multiple
subplots
(4) Multiple
subplots of different sizes
(5) The motion of the
projectile can be shown as an animated gif
|


|
PYTHON CODE Graphs22.py #
PROJECTILE MOTION GRAPHICS import
numpy import
numpy as np import
scipy.special import
scipy.special as sps import
math import
matplotlib.pyplot as plt pi
= np.pi from
pylab import figure, plot,show,legend,xlabel,ylabel,title,grid from
pylab import ylim,xlim from
numpy import linspace,sin,cos,exp, zeros, ones from
matplotlib.animation import FuncAnimation, PillowWriter import
time #%%
INPUT PARAMETERS
>>>>>>>>>>>>>>>>>>>>>>>>>>>>>>>>>>>>>>>>>>>>>>>>>> #
time span tMin
= 0; tMax = 8; Nt = 55 #
Initialize arrays: displacements and velocities (magnitude & angle [deg]) x1_0
= 0; y1_0 = 0; v1_0 = 35; phi1_0 = 70 x2_0
= 0; y2_0 = 0; v2_0 = 25; phi2_0 = 40 ax_0
= 0; ay_0 = -9.9 #%% CALCULATIONS: time, acceleration, velocity,
displacements #
Time / velocity / displacement t
= linspace(tMin,tMax, Nt) Ax
= ax_0*ones(Nt) Ay
= ay_0*ones(Nt) v1x_0
= v1_0*cos(phi1_0*pi/180) v1y_0
= v1_0*sin(phi1_0*pi/180) v1x = v1x_0*ones(Nt) v2x_0
= v2_0*cos(phi2_0*pi/180) v2y_0
= v2_0*sin(phi2_0*pi/180) v2x = v2x_0*ones(Nt) v1y
= v1y_0 + ay_0*t v2y
= v2y_0 + ay_0*t x1
= x1_0 + v1x_0*t x2
= x2_0 + v2x_0*t y1
= y1_0 + v1y_0*t + 0.5*ay_0*t**2 y2
= y2_0 + v2y_0*t + 0.5*ay_0*t**2 #
Max height ind
= np.where(v1y <0)[0][0]-1; tHmax1 = t[ind] y1Max
= max(y1) ind
= np.where(v2y <0)[0][0]-1; tHmax2 = t[ind] y2Max
= max(y2) #
Range tR1
= 2*tHmax1 xR1
= tR1*v1x_0 tR2
= 2*tHmax2 xR2
= tR2*v2x_0 #%%
GRAPHICS #
font1 = {'family':'Tahoma','color':'black','size':12} #
plt.rcParams['font.family'] = ['Tahoma'] plt.rcParams['font.size']
= 12 plt.rcParams["figure.figsize"]
= (4,4) #
Fig 1:TRAJECTORY x vs y fig,
ax = plt.subplots(1) fig.subplots_adjust(top
= 0.92, bottom = 0.23, left = 0.20,\ right = 0.92, hspace =
0.20,wspace=0.2) ax.axis('equal') ax.xaxis.grid() ax.yaxis.grid() ax.set_ylabel('y [m]',color= 'black') ax.set_xlabel('x [m]',color = 'black') ax.set_xlim([0,
101]) ax.set_ylim([-20,
80]) ax.set_xticks(np.arange(0,101,20)) ax.set_yticks(np.arange(-20,81,20)) ax.set_title('Trajectory',
fontsize = 12) ax.text(1,
70, 'y1$_{max}$ = %2.2f m' % max(y1), fontsize = 12, color = 'blue') ax.text(1,
-10, 'y2$_{max}$ = %2.2f m' % max(y2), fontsize = 12, color = 'red') #fig.tight_layout() ax.plot(x1,y1,'b',lw
= 2, label = '1') ax.plot(x2,y2,'r',lw
= 2, label = '2') ax.legend() fig.savefig('a001.png') #%%
Fig 2: t vs y t vs y plt.rcParams["figure.figsize"]
= (5,4) fig,
ax = plt.subplots(1) fig.subplots_adjust(top
= 0.94, bottom = 0.23, left = 0.20,\ right = 0.82, hspace =
0.20,wspace=0.2) ax.xaxis.grid() ax.yaxis.grid() ax.set_ylabel('y [m]',color= 'blue') ax.set_xlabel('t [s]',color = 'black') ax.set_xlim([0,
10]) ax.set_ylim([-70,
60]) ax.set_xticks(np.arange(0,11,2)) ax.set_yticks(np.arange(-70,61,20)) ax.tick_params(axis='y',
labelcolor="blue") ax.set_title('v$_0$
= %2.1f m/s ' % v1_0 + \ '$ \phi_0$ = %2.1f deg' % phi1_0,fontsize = 10, color = 'black' ) ax.text(0.2,
-60, 'v1$_y$ = 0' + ' y1$_{max}$ =
%2.2f m' % max(y1) \ , fontsize = 10, color = 'blue') ax.plot(t,y1,'b',lw
= 2) ax2
= ax.twinx() ax2.set_ylabel('vy [m/s]',color= 'red') ax2.set_xlabel('t [s]',color = 'red') ax2.set_xlim([0,
11]) ax2.set_ylim([-70,
60]) ax2.set_xticks(np.arange(0,11,2)) ax2.set_yticks(np.arange(-80,61,20)) ax2.tick_params(axis='y',
labelcolor = 'red') #ax2.yaxis.grid(color
= 'r') ax2.plot(t,v1y,'r',lw
= 2) ax2.plot([0,100],[0,0],'r',
lw = 0.5) fig.legend(['
y ',' vy'],loc = 'lower left',ncols = 2 ) fig.savefig('a002.png') #%% Fig 3:
4 subplots plt.rcParams["figure.figsize"]
= (7,7) fig1,
axes = plt.subplots(nrows=2, ncols=2) fig1.subplots_adjust(top
= 0.94, bottom = 0.12, left = 0.120,\ right = 0.95, hspace =
0.36,wspace=0.40) axes[0,0].set_title('Trajectorty',
fontsize = 10) axes[0,1].set_title('Displacement',
fontsize = 10) axes[1,0].set_title('Velocity',
fontsize = 10) axes[1,1].set_title('Acceleration',
fontsize = 10) R
= 0; C = 0 # x vs y axes[R,C].set_ylabel('y [m]',color= 'black',fontsize = 12) axes[R,C].set_xlabel('x [m]',color = 'black',fontsize = 12) axes[R,C].set_xlim([0,
101]) axes[R,C].set_ylim([-20,
80]) axes[R,C].set_xticks(np.arange(0,101,20)) axes[R,C].set_yticks(np.arange(-20,81,20)) axes[R,C].xaxis.grid() axes[R,C].yaxis.grid() axes[R,C].text(5,
70, 'v$_0$ = %2.1f m/s ' % v1_0 + \ '$ \phi_0$ = %2.1f deg' % phi1_0,fontsize = 10, color = 'black' ) axes[R,C].plot(x1,
y1, 'blue') R
= 0; C = 1 # t vs x,y axes[R,C].set_ylabel('x
& y [m]',color= 'black',fontsize =
12) axes[R,C].set_xlabel('t [s]',color = 'black',fontsize = 12) axes[R,C].set_xlim([0,
10]) axes[R,C].set_xticks(np.arange(0,11,2)) #axes[0,1].set_ylim([-20,
60]) #axes[0,1].set_yticks(np.arange(-20,81,20)) axes[R,C].xaxis.grid() axes[R,C].yaxis.grid() axes[R,C].plot(t,
y1, 'blue') axes[R,C].plot(t,
x1, 'red') R
= 1; C = 0 # t vs vx, vy axes[R,C].set_ylabel('v [m/s]',color= 'black',fontsize = 12) axes[R,C].set_xlabel('t [s]',color = 'black',fontsize = 12) axes[R,C].set_xlim([0,
10]) axes[R,C].set_xticks(np.arange(0,11,2)) axes[R,C].xaxis.grid() axes[R,C].yaxis.grid() axes[R,C].plot(t,
v1y, 'blue') axes[R,C].plot(t,
v1x, 'red') R
= 1; C = 1 # t vs ax, ay axes[R,C].set_ylabel('v [m/s]',color= 'black',fontsize = 12) axes[R,C].set_xlabel('t [s]',color = 'black',fontsize = 12) axes[R,C].set_xlim([0,
10]) axes[R,C].set_xticks(np.arange(0,11,2)) axes[R,C].xaxis.grid() axes[R,C].yaxis.grid() axes[R,C].plot(t,
Ay, 'blue') axes[R,C].plot(t,
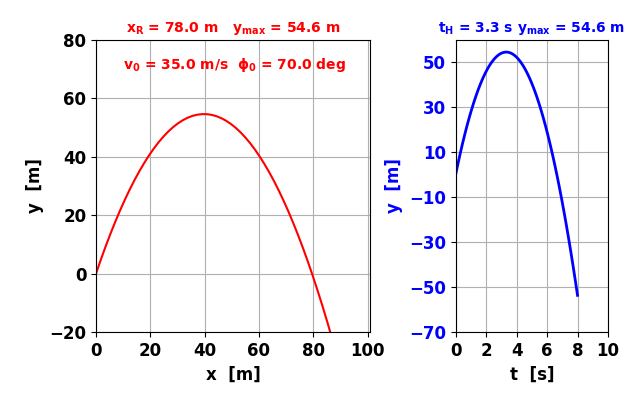
Ax, 'red') fig1.savefig('a003.png') #%% Fig 4: subplots plt.rcParams["figure.figsize"]
= (6.4,4) fig3,
axes = plt.subplots(1, 2, gridspec_kw={'width_ratios': [1.8, 1]}) fig3.subplots_adjust(top
= 0.90, bottom = 0.17, left = 0.150,\ right = 0.95, hspace =
0.36,wspace=0.40) axes[0].set_ylabel('y [m]',color= 'black',fontsize = 12) axes[0].set_xlabel('x [m]',color = 'black',fontsize = 12) axes[0].set_xlim([0,
101]) axes[0].set_ylim([-20,
80]) axes[0].set_xticks(np.arange(0,101,20)) axes[0].set_yticks(np.arange(-20,81,20)) axes[0].xaxis.grid() axes[0].yaxis.grid() axes[0].set_title('x$_R$
= %2.1f m' % xR1 + ' y$_{max}$ =
%2.1f m' % max(y1) \ , fontsize = 10, color = 'red') #
axes[0].text(25, 70, 'v$_0$ = %2.2f m/s' % v1x_0 + \ # '$\phi_0$ deg' %
phi1_0, fontsize = 12, color = 'red') axes[0].text(10,
70, 'v$_0$ = %2.1f m/s ' % v1_0 + \ '$ \phi_0$ = %2.1f deg' % phi1_0,fontsize = 10, color = 'red' ) axes[0].plot(x1,
y1, color='red') axes[1].xaxis.grid() axes[1].yaxis.grid() axes[1].set_ylabel('y [m]',color= 'blue') axes[1].set_xlabel('t [s]',color = 'black') axes[1].set_xlim([0,
10]) axes[1].set_ylim([-70,
60]) axes[1].set_xticks(np.arange(0,11,2)) axes[1].set_yticks(np.arange(-70,61,20)) axes[1].tick_params(axis='y',
labelcolor="blue") axes[1].set_title('t$_H$
= %2.1f s' % tHmax1 + ' y$_{max}$ = %2.1f m' % max(y1) \ , fontsize = 10, color = 'blue') axes[1].plot(t,y1,'b',lw
= 2) fig3.savefig('a004.png') #%% NUMERICAL SUMMARY plt.rcParams['font.size']
= 12 plt.rcParams["figure.figsize"]
= (6,5) fig,
ax = plt.subplots(1) ax.set_title('PROJECTILE
MOTION', fontsize = 10) ax.set_xlim([0,
101]) ax.set_ylim([0,
120]) ax.set_xticks([]) ax.set_yticks([]) H
= 110; h = 10; ax.text(2,H,'Acceleration:
a$_x$ = %2.1f m.s$^{-2}$' % ax_0 + \ ' a$_y}$ = %2.1f m.s$^{-2}$' %
ay_0 , fontsize = 10) H
= H - h ax.text(2,H,'(1)
Initial Displacement: x$_0$ = %2.1f m' % x1_0 + \ '
y$_0}$ = %2.1f m' % y1_0 ,
fontsize = 10, color = [0,0,1]) H
= H - h ax.text(2,H,'(1)
Initial velcocity: v$_{0}$ = %2.1f m.s$^{-1}$' % v1_0 + \ ' $\phi_0$ = %2.1f deg' % phi1_0 , fontsize = 10, color = [0,0,1]) H
= H - h ax.text(20,H,'v$_{x0}$
= %2.1f m.s$^{-1}$' % v1x_0 + \ '
v$_{y0}$ = %2.1f m.s$^{-1}$' % v1y_0
, fontsize = 10, color = [0,0,1]) H
= H - h ax.text(2,H,'(1)
Max height v$_y$ = 0 ' + ' t = %2.1f s' % tHmax1 + \ '
y$_{max}$ = %2.1f m' % y1Max ,
fontsize = 10, color = [0,0,1]) H
= H - h ax.text(2,H,'(1)
Range y = 0 ' + ' t = %2.1f s' % tR1 + \ '
x$_{R}$ = %2.1f m' % xR1 ,
fontsize = 10, color = [0,0,1]) H
= H - h ax.text(2,H,'(2)
Initial Displacement: x$_0$ = %2.1f m' % x2_0 + \ '
y$_0}$ = %2.1f m' % y2_0 ,
fontsize = 10, color = [1,0,0]) H
= H - h ax.text(2,H,'(2)
Initial velcocity: v$_{0}$ = %2.1f m.s$^{-1}$' % v2_0 + \ ' $\phi_0$ = %2.1f deg' % phi2_0 , fontsize = 10, color = [1,0,0]) H
= H - h ax.text(20,H,'v$_{x0}$
= %2.1f m.s$^{-1}$' % v2x_0 + \ '
v$_{y0}$ = %2.1f m.s$^{-1}$' % v2y_0
, fontsize = 10, color = [1,0,0]) H
= H - h ax.text(2,H,'(2)
Max height v$_y$ = 0 ' + ' t = %2.1f s' % tHmax2 + \ '
y$_{max}$ = %2.1f m' % y2Max ,
fontsize = 10, color = [1,0,0]) H
= H - h ax.text(2,H,'(2)
Range y = 0 ' + ' t = %2.1f s' % tR2 + \ '
x$_{R}$ = %2.1f m' % xR2 ,
fontsize = 10, color = [1,0,0]) #
fig.savefig('a005.png') #%% Fig 6:
ANIMATION plt.rcParams['font.size']
= 12 plt.rcParams["figure.figsize"]
= (4,4) #
Fig 1:TRAJECTORY x vs y fig,
ax = plt.subplots(1) fig.subplots_adjust(top
= 0.92, bottom = 0.20, left = 0.20,\ right = 0.92, hspace =
0.20,wspace=0.2) ax.axis('equal') ax.xaxis.grid() ax.yaxis.grid() ax.set_ylabel('y [m]',color= 'black') ax.set_xlabel('x [m]',color = 'black') ax.set_xlim([0,
101]) ax.set_ylim([-20,
80]) ax.set_xticks(np.arange(0,101,20)) ax.set_yticks(np.arange(-20,81,20)) ax.plot(x1,y1,'b',lw
= 2, label = '1') ax.plot(x2,y2,'r',lw
= 2, label = '2') txt
= ax.text(5,70, '') txtT
= ax.set_title('Trajectory', fontsize = 12) line1,
= ax.plot([], [], 'bo', ms = 8) line2,
= ax.plot([], [], 'ro', ms = 8) ax.grid('visible') def
init(): line1.set_data([], []) line2.set_data([], []) txt.set_text('') # txtT.set_text('') return
line1, line2, txt def
animate(n): u1 = x1[n] v1 = y1[n] line1.set_data([u1], [v1]) u2 = x2[n] v2 = y2[n] line2.set_data([u2], [v2]) txt.set_text('time = %.2f' % t[n] + '
s') #txtT.set_text('time = %.2f' % t[n] + '
s') time.sleep(0.1) return
line1, line2, txt, anim
= FuncAnimation(fig, animate, init_func = init, frames = Nt, interval =
20, blit = True, repeat = False) anim.save('ag_005.gif', fps=10) |