|
NUMERICAL ANALYSIS OF OPTICAL AND ELECTROMAGNETIC PHENOMENA FABRY – PEROT INTERFEROMETER Ian
Cooper matlabvisualphysics@gmail.com Matlab Script Download
Directory op_LE_010.mlx Live Editor Script for the
modelling the operation of a Fabry-Perot interferometer. The Fabry-Perot
interferometer is instrument used in precision wavelength measurements and
has extremely high resolution. The modelling allows one to investigate the
general features of the interferometer. The instrument is very sensitive, so
you need to be careful in changing the input parameters. You may need to
adjust the limits for the slider controls. It is best to Disable
Synchronous Scrolling of the Output Window. The interferometer is an
extremely sensitive instrument. Slight variations in the input parameters can
dramatically change the irradiance distribution. Rather than use a trial and
error approach to altering the variables, we can estimate a possible range
for the separation distance between the interferometer plates from the inputs
of reflectance, wavelength and wavelength increment. The minimum distance
between the plates is estimated from the resolving power and the maximum
separation distance of the plates is estimated from the free spectral range.
A summary in the Output Window for possible values of the plate separation
distance and maximum viewing angle for the irradiance distribution are
displayed. These values then can
be entered into the controls (inputs) for the plate separation distance and
max angle for viewing the irradiance distribution. The Script calls the
function colorCode.m to assign
a color that matches the wavelength of visible
light to its “true” color. op_010A.m Script used for plotting
the coefficient of finesse F
and the
Airy function AF. Fabry-Perot Interferometer The Fabry-Perot
interferometer uses multiple-bean interference to measure wavelengths with
high precision and accuracy and to study the fine structure of spectrum
lines. This instrument is probably the most adaptable of all interferometers.
It is used for the determination of the refractive indices of gases and the
calibration of the metre in terms of wavelength. The instrument was devised
in 1899 by C. Fabry and A. Perot.
The Fabry-Perot instrument is essentially two parallel optically flat
and partially reflecting plates of quartz or glass. The surfaces must be
extremely flat and parallel to obtain the maximum fringe sharpness (a
flatness of the order of 1/20 to 1/100 wavelength is necessary). If the space
between the reflecting plates is fixed, the instrument is called an etalon. If the plates are movable, then the device is
called an interferometer.
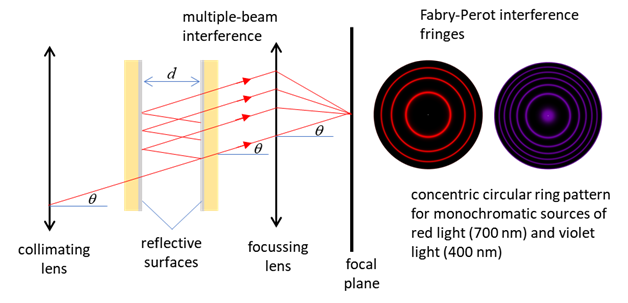
In use, the interferometer is usually mounted between a collimating lens and
a focussing lens. The interference fringes form a set of circular concentric
rings in the focal plane of the focussing lens as shown in figure 1.
Fig. 1. Fabry-Perot interferometer. The
fringe patterns were created using the Script op_LE_010.mlx. Each ring is specified by its order m. Generally, the plate
separation distance d
is much
larger than the wavelength Consider a narrow,
monochromatic beam (wavelength (1)
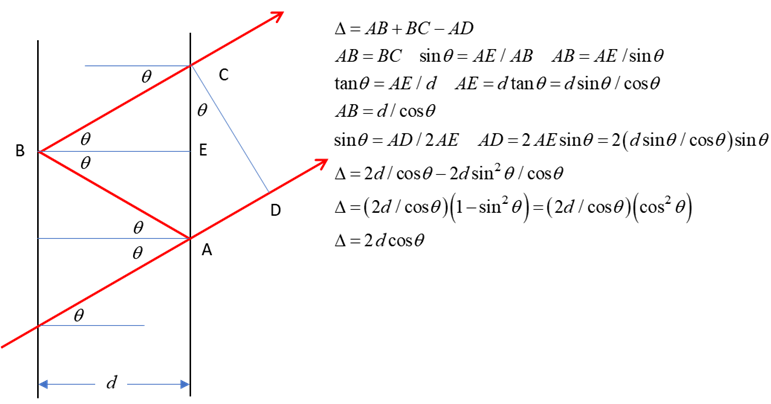
Fig. 2. Interference of light travelling
through the space between the reflective plates depends on the path
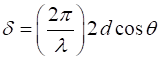
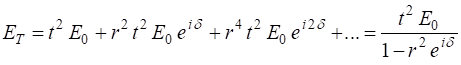
difference Thus, the phase difference between successive reflected beams is (2) When a single
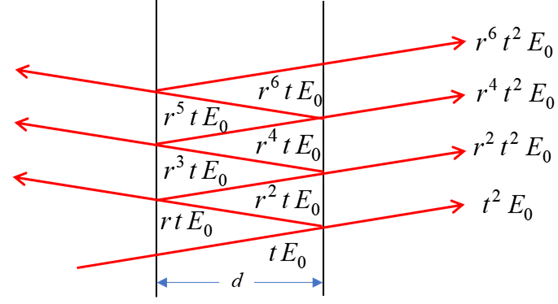
ray of light strikes one of the reflective surfaces (mirrors) with amplitude
or
where
Fig. 3. Paths of light rays in multiple reflection between the two reflective surfaces. From figure 3, and taking
into account the factor (3)
A phase change may occur on reflection. However, in this case the total phase change due to the two successive reflections can be taken as zero. The irradiance
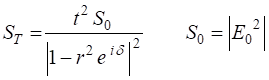
(intensity) of the transmitted light is
(4)
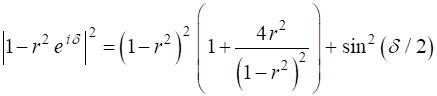
(5)
(6)
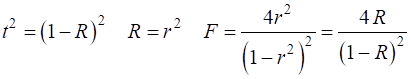
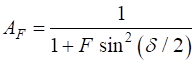
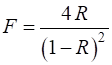
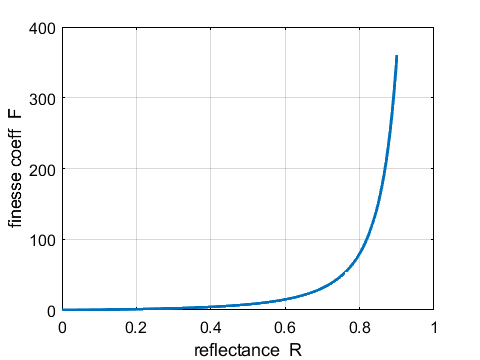
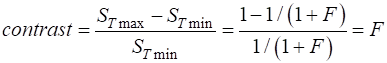
The coefficient of finesse is a
measure of the sharpness of the interference fringes (measure of the fringe contrast). The coefficient of finesse
Fig. 4. Coefficient of finesse F as a function of reflectance R. op_010A.m
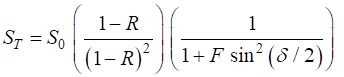
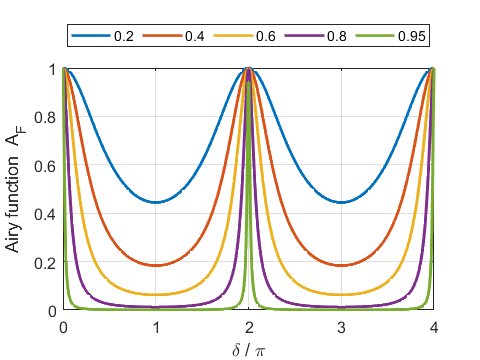
Fig. 5. Airy function The
transmitted irradiance
The path difference between successive transmitted rays is given by equation 1
(1) A peak in the irradiance distribution (ring) due to constructive interference of the multiple beams occurs when this path difference is an integer multiple of the wavelength, hence
(7)
where m is called the order for the interference. Equation 7 describes the set of circular rings in the irradiance distribution as shown in figure 1. The fringe contrast is measured by F (coefficient of finesse)
The fringe
contrast values for the plots shown in figure 5 are displayed in the Command
Window using the Script op_010A.m R contrast 0.20 1 0.40 4 0.60 15 0.80 80 0.95 1520 Free Spectral
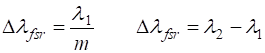
range It is useful
to define the free spectral
range of the instrument When The optical
path difference (1) For
constructive interference, the optical path length must equal an integer
multiple of the wavelength
(8) Near the
centre of the circular fringe pattern (9)
To avoid associating fringes of one order with those of the next, then we should have
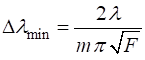
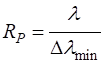
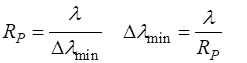
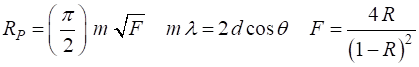
Resolving Power The accuracy
with which the Fabry-Perot interferometer can measure wavelengths depends
upon the smallest wavelength difference
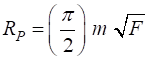
(10) where The resolving power (11) For a Fabry-Perot interferometer, the resolving power RP as a function of the reflectance R of the mirrors is (12) This resolving
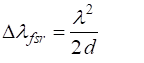
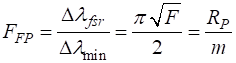
power The free
spectral range is
Hence, a large order m is detrimental to a large free spectral range whereas it is favourable to good resolution. We can give a
number to represent a figure of merit for the
Fabry-Perot interferometer which is called its finesse
(13)
A large
finesse of the interferometer Matlab
Explorations
op_LE_010.mlx Run the Script with the inputs
Note, the
distance d
was set to The Script has four output sections as shown in figures 6, 7, 8 and 9.
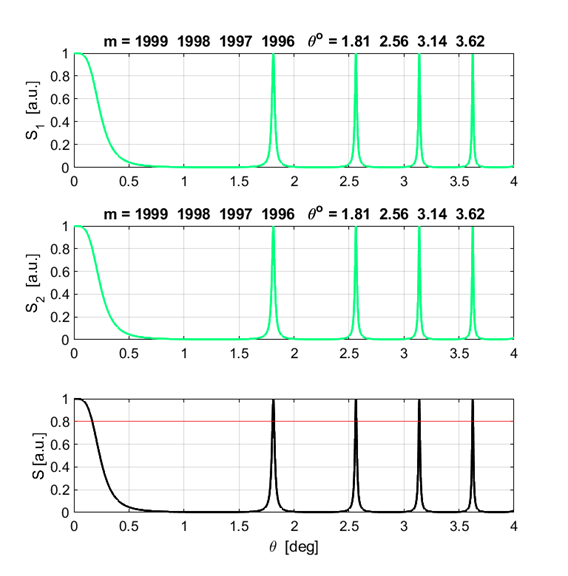
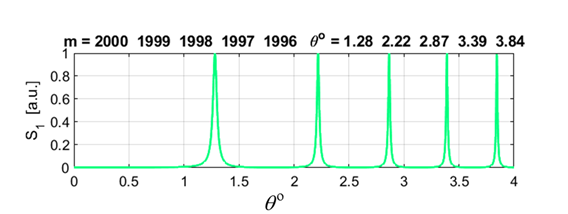
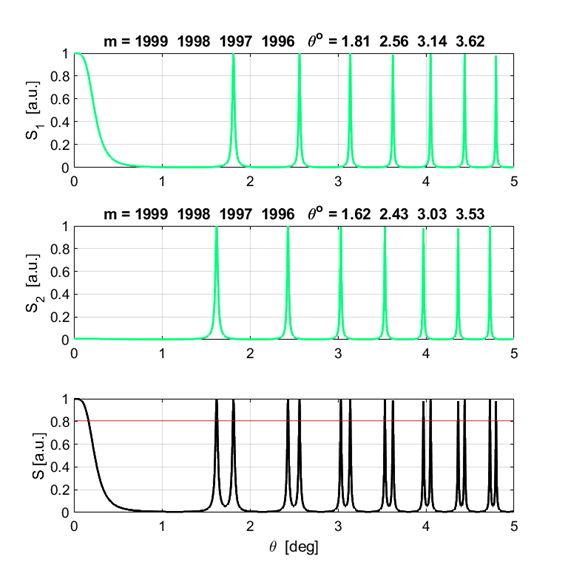
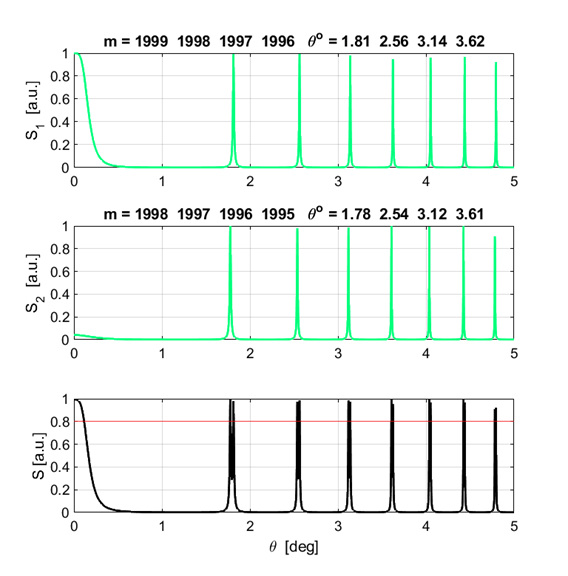
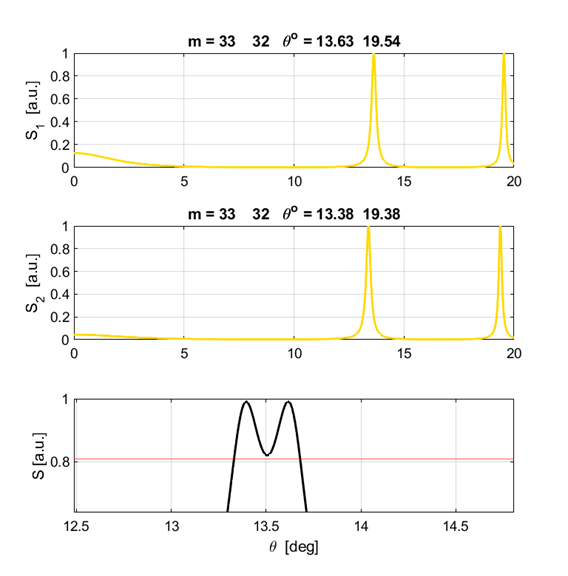
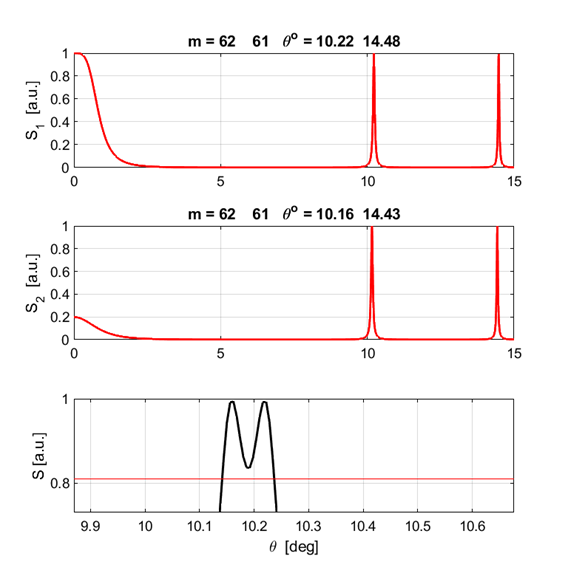
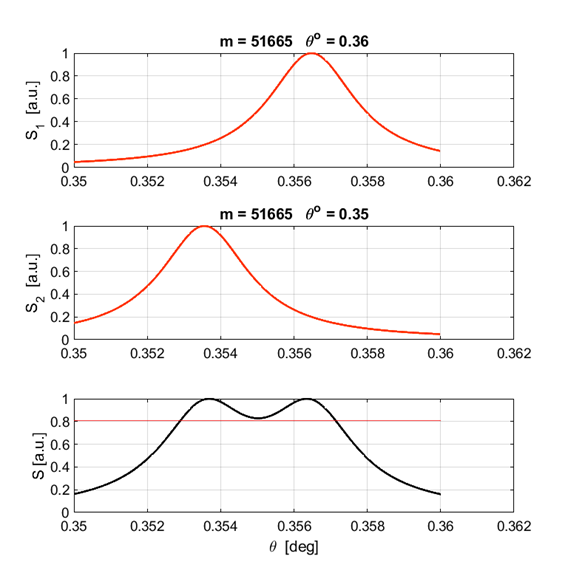
Fig. 6. Normalized irradiance
distribution for each individual wavelength and the resultant distribution.
The titles give the order and their corresponding angles for the interference
peaks.
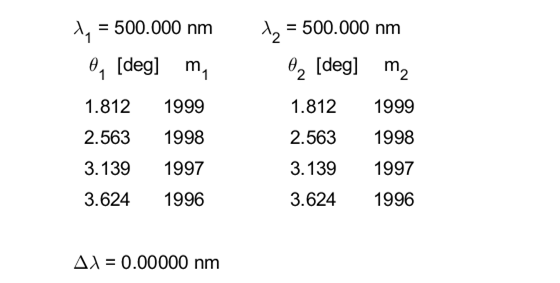
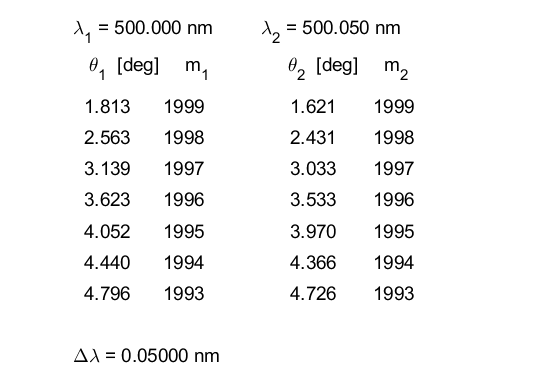
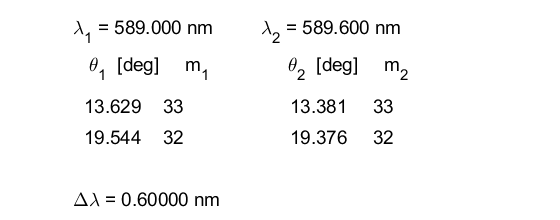
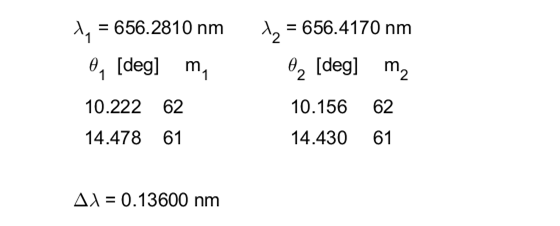
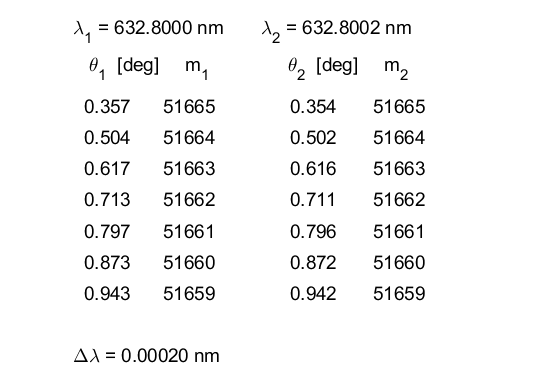
Fig. 7. Table showing the angles
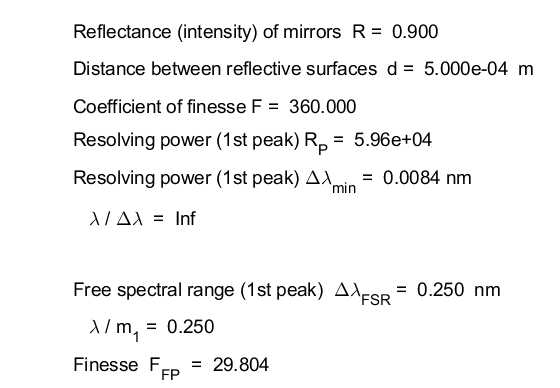
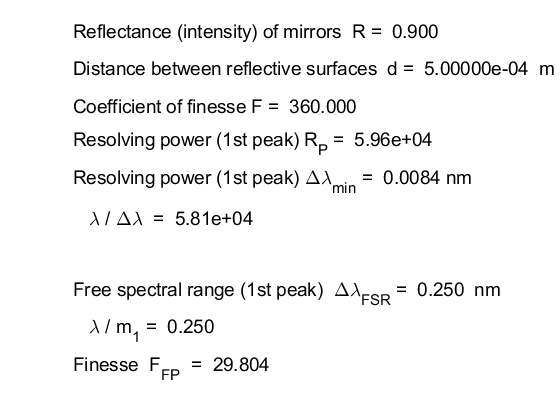
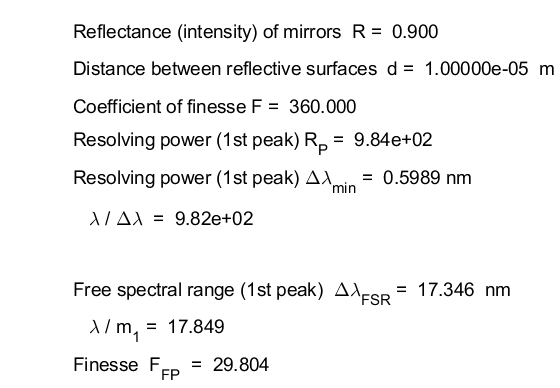
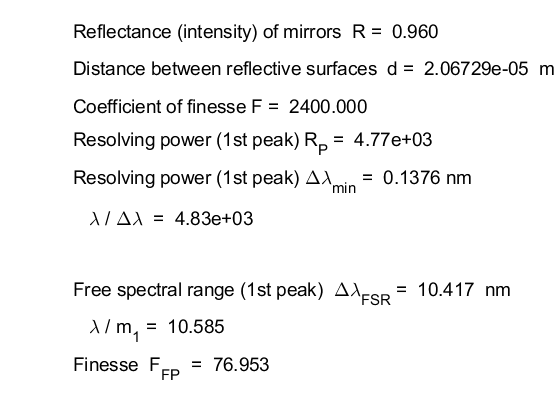
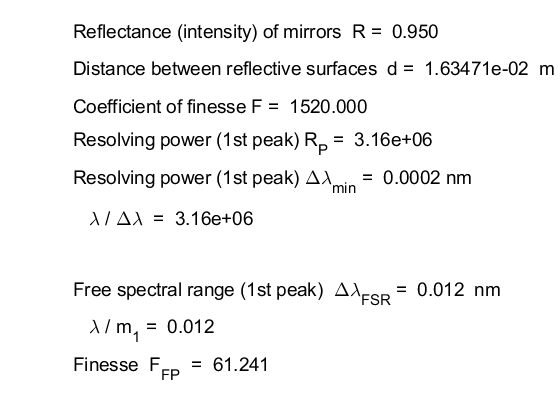
Fig. 8. Table of
numerical values for the main parameters describing the Fabry-Perot
interferometer.
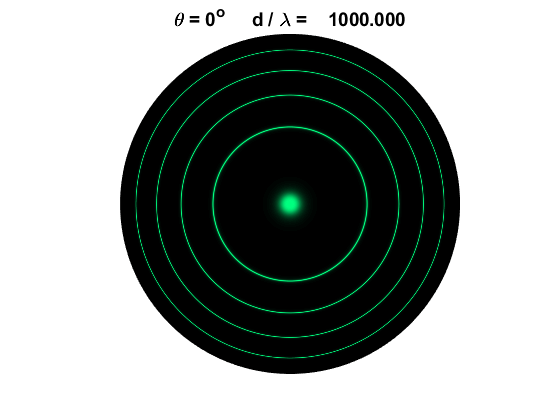
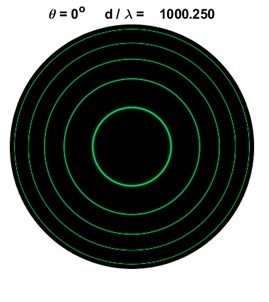
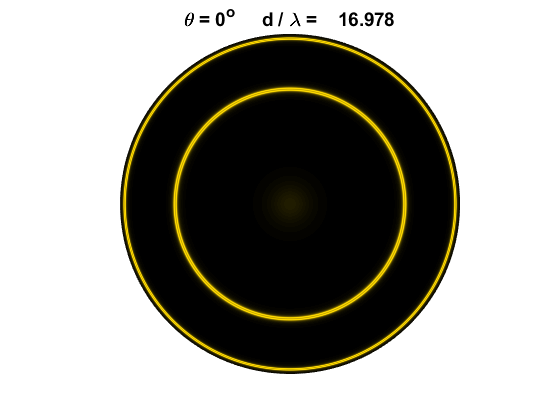
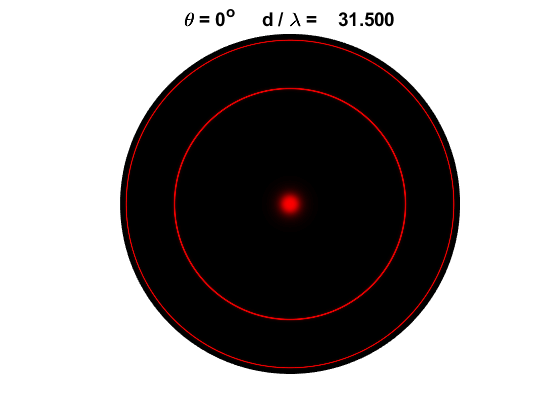
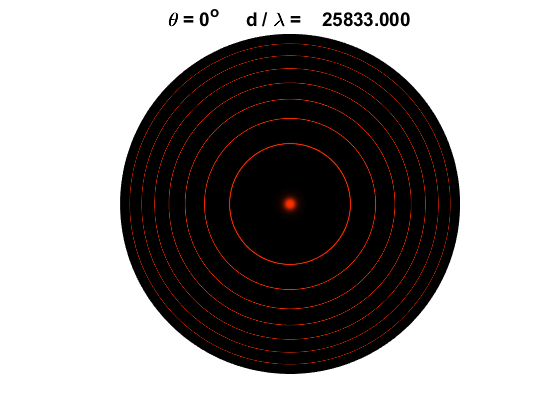
Fig. 9. Concentric circular (ring)
fringes for the Fabry-Perot interferometer. Equation 7
describes the angle (7) The order m
of the peaks decreases with increasing values of If there is
a peak at the center of the fringe pattern Changing the plate
separation distance When the
distance d
is set to Input
parameters
Fig. 10. Normalized
irradiance fringe pattern with a dark center. Change the plate separation distance in
small increments and observe how the positions of the rings change Input
parameters
5.000 1.813 5.005 3.137
5.010
4.048 As d increases
the angle
Change the wavelength in very small
increments and observe how the positions of the rings change Input parameters
Fig. 11. As the wavelength is increased,
the rings move inward
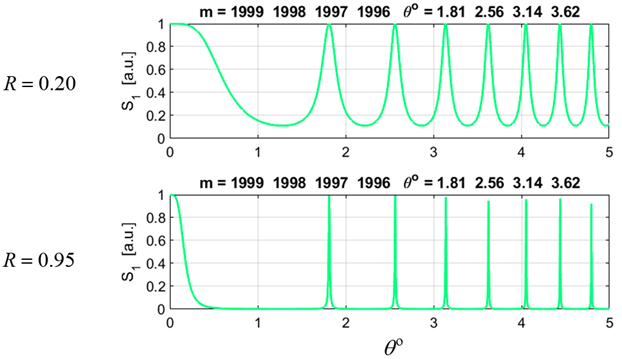
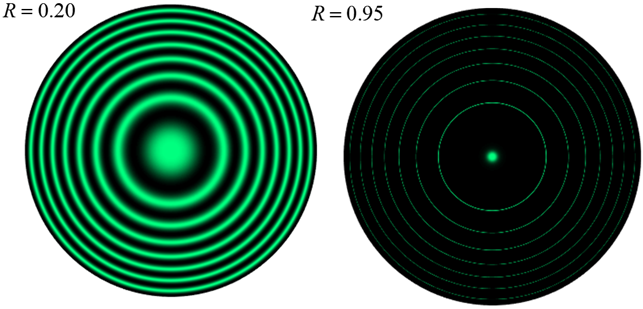
Change the reflectance and observe the
changes in the fringe pattern. Input
parameters
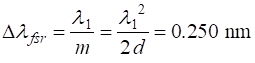
Fig. 12. The rings become sharper (peaks narrower) as the reflectance R increases. Free spectral range: Slowly increase
the wavelength difference Input parameters
Equations 8 and 9 give the theoretical estimate for the free spectral range
which agrees
with the simulation value for
0.100 2.293 0.200 1.985 0.220 1.919 0.230 1.885 0.240 1.849
0.250
1.813 0.260 1.777
Fig. 13A.
Fig. 13B. Resolution / Resolving Power: Adjust the
wavelength difference Input
parameters
We can
calculate the minimum wavelength difference
(12)
(12) (11) A summary of the calculations is given in one of the Output Windows
Running the
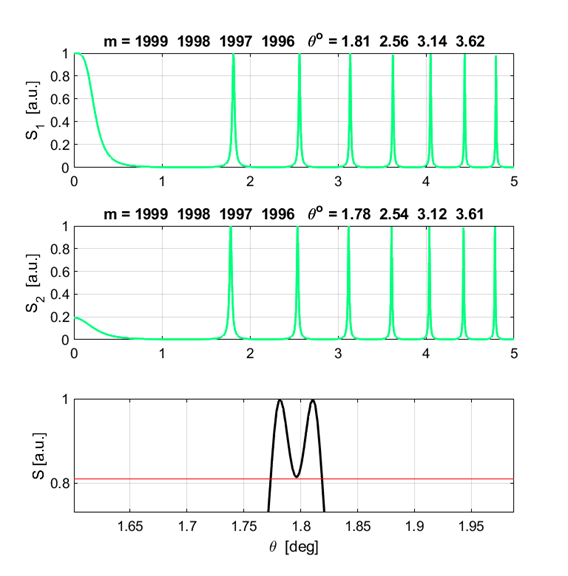
Script, the minimum wavelength difference using the Rayleigh criteria is
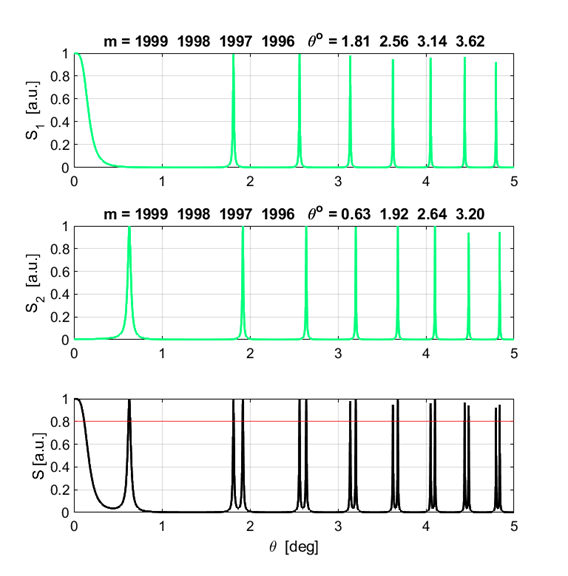
Fig. 14. The irradiance pattern for the peaks the same strength and of order m = 1999. The dip between the two peaks of different wavelengths satisfies the resolution criteria (0.81). We say that the two peaks are resolved for the minimum wavelength separation
The sodium doublet
lines The well-known
D line in the spectrum of sodium is a doublet with the two distinct spectral
lines of wavelengths 580.0 and 589.6 nm. For a Fabry-Perot interferometer
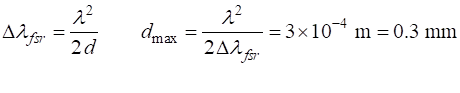
with reflectance The maximum separation of the plates is limited by the free spectral range. The value for the free spectral range is Using equation
9, we can thus calculate the maximum plate separation
(9)
So that there
is no confusion between the orders, the plate separation must be less than
the maximum plate separation,
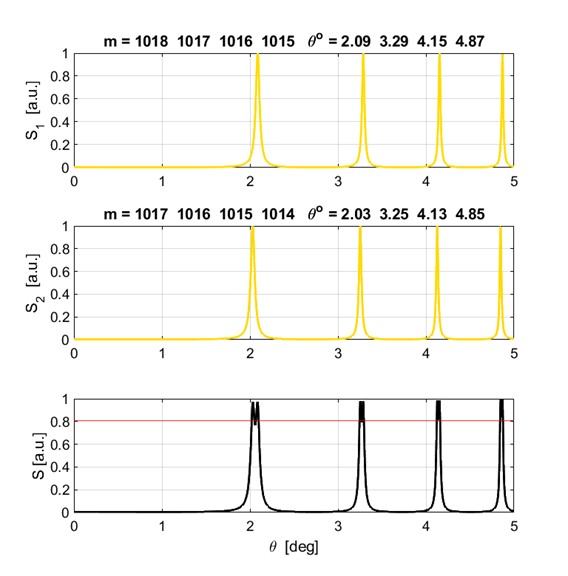
Fig. 15. If the plate separation is too
large, the orders of the peaks overlap leading to confusion in interpreting
the irradiance distribution. Notice, peak 1017 (
For (6)
and the resolving power is (11)
For a Fabry-Perot interferometer, the resolving power RP as a function of the reflectance R of the mirrors is (12)
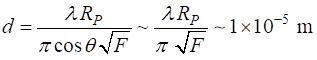
Hence, we can estimate the smallest plate separation to resolve the two sodium D lines
Input parameters
H The
reflectance of the plates of a Fabry-Perot interferometer is 0.96. Use the
Script op_LE_010.mlx
to resolve the doublet for the
m_min = 63.00
m d_min = 2.06728515e-05 m d_max = 1.58347335e-03 m theta_max_min = 10.22
m theta_max_max = 0.90
m
He-Ne laser (textbook
style problem) A
Fabry-Perot interferometer with a plate reflectance of 0.950 is to be used to
resolve the mode structure of a He-Ne laser operating at 632.8 nm. The
frequency separation between modes is 150 MHz.
Determine: (a) the minimum resolvable wavelength interval; (b) coefficient of
finesse; (c) the resolving power (resolution); (d) the plate separation
distance to resolve the two laser lines; (e) free spectral range; (f) the
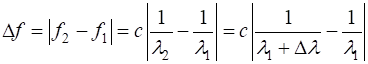
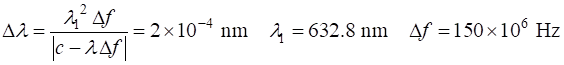
finesse. From the
frequency separation, we can calculate the difference in the two wavelengths
of the laser light.
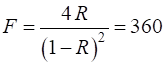
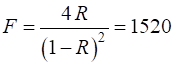
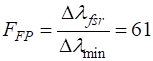
Coefficient
of finesse (equation 6)
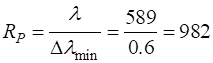
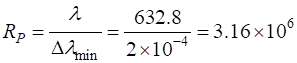
The required
resolving power (equation 11)
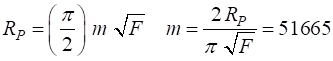
The resolving power is also given by equation (12). Therefore, the order m of a fringe to be resolved must be
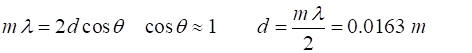
The minimum plate separation d to resolve the two spectral lines is approximately given by
(equation 7)
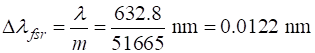
The free spectral range is given by
equation 8
Note: there
will be no confusion of the orders, since We can run the Live Editor Script op_LE_010.mlx to confirm the above calculations. Input parameters The value for the value of d was found by typing 51666*lambda1/2 into the Command Window.
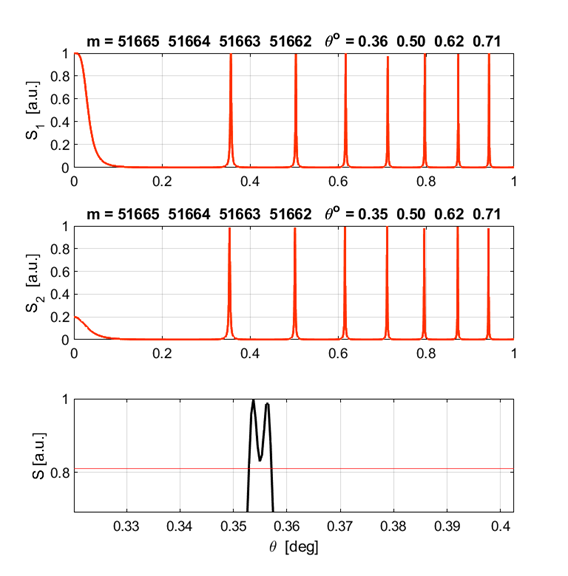
In the total
irradiance plot, the zoom feature was used. However, a clearer picture of the
two peaks and the dip between them is better shown by changing the range of
the angle
|