S
|
VISUALIZATION OF THE PHASE OF COMPLEX FUNCTIONS USING COLOR: A
TRAVELLING TRANSVERSE WAVE Download
Matlab mscripts Directory wm_complex01.m The phase
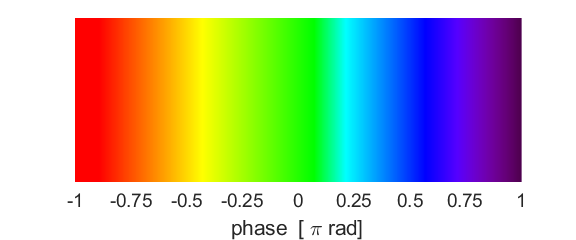
of a complex number can be represented by an assigned color.
The
scripts calls the function ColorCode.m to assign a color
for the phase of a complex number in the range from
COMPLEX NUMBERS A complex number can be represented by its magnitude and phase. It is
not easy to show the magnitude and phase of a complex number. However, the
phase of the complex number
Fig.
1. A color
is used for to show the phase of a complex number. TRAVELLING
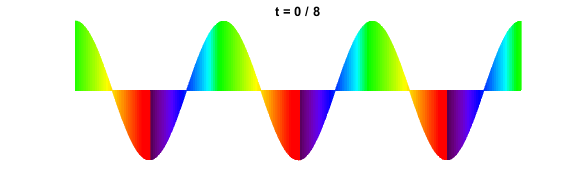
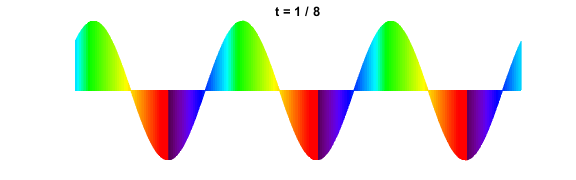
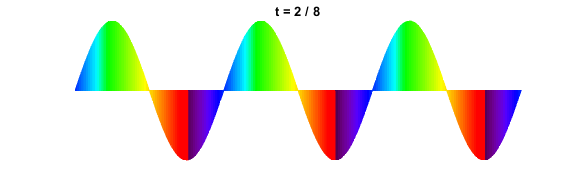
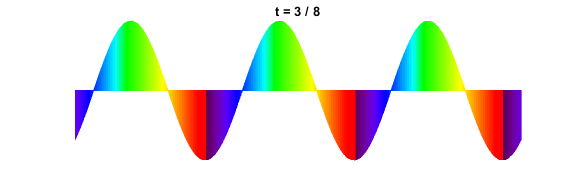
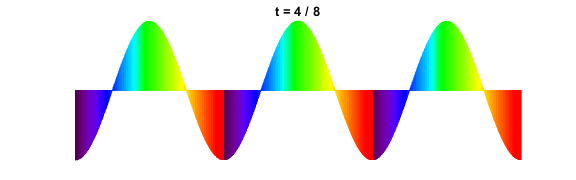
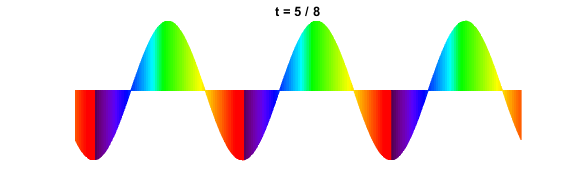
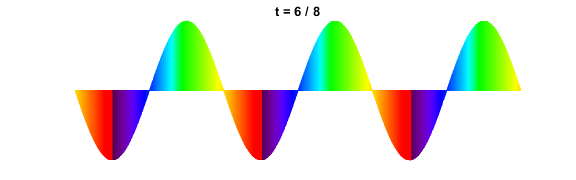
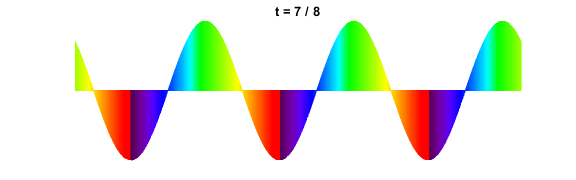
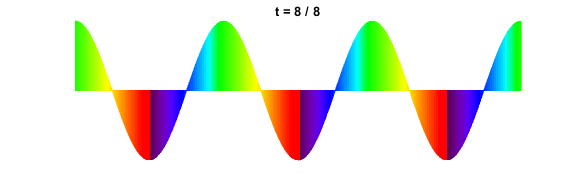
TRANSVERSE WAVE As an example of illustrating the phase of a complex number, we can
consider the propagation of a [1D] transverse described by the exponential
function
The phase of the wavefunction
Fig.
2. The wavefunction By examination of the sequence of plots in figure 2, the wave advances
one wavelength in a time interval of one period. Points along the wave
vibrate with different phases. Points along the wave that are separated by one
wavelength, vibrate in phase. The script
wm_complex01.m can easily
modified to animate the motion of the travelling wave. The animation can be
saved as an animated gif or as an avi movie. |