|
ANIMATION OF A TRAVELLING TRANSVERSE WAVE Download
Matlab mscripts Directory wm_ttw.m An animation of a
one-dimensional travelling wave is displayed. The animation can be saved as
an animated gif
file or as a avi file by setting the value the parameter flagA. The saved animated gif files and avi files can be used for display purposes and embedded
in html documents. The advantage of the avi files
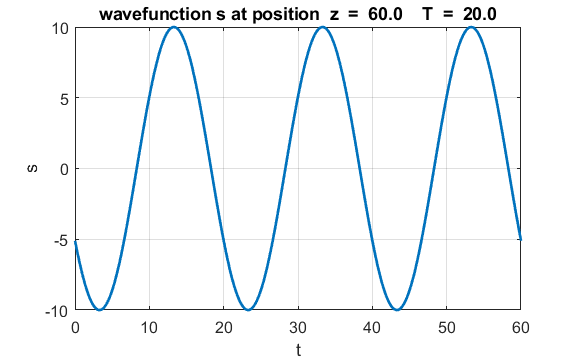
is the animations can be repeatedly stopped and restarted. wm_tt2.m A [3D] view of a
one-dimensional wave propagating in the Z direction which is described by the
wavefunction The first-dimension
corresponds to time t, the second-dimension to z and the third-dimension the value
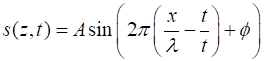
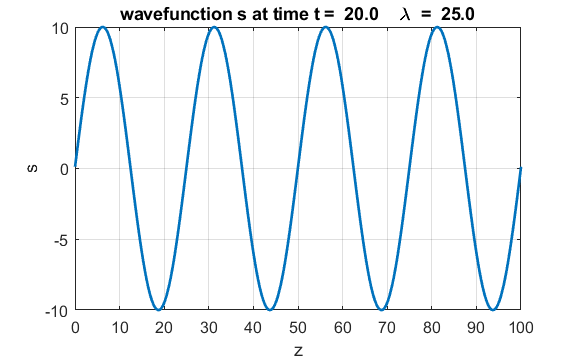
of the wavefunction [1D] TRAVELLING HARMONIC WAVE A [1D] travelling
harmonic wave can be represented by the wavefunction y(z,t) that is periodic both in space (z)
and time (t). The profile of the
travelling wave is sinusoidal at any instant and each point in the track of
the wave performs simple harmonic motion. The wave function y(z,t) is given by equation 1. (1)
(2)
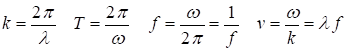
where A
is the amplitude, k is the propagation constant (or
wave number), It is not possible to
draw a simple graph of the wavefunction given by equation 1. So, animations
of travelling waves can play a very important role to help improve
one’s understanding of the mathematical description of travelling
waves. What do the
animations tells us about the physics and mathematics of the motion of
travelling waves? · Easily distinguish between particle
velocities in the medium and the wave velocity of the disturbance. The
velocities are orthogonal to each other. The wave velocity is constant
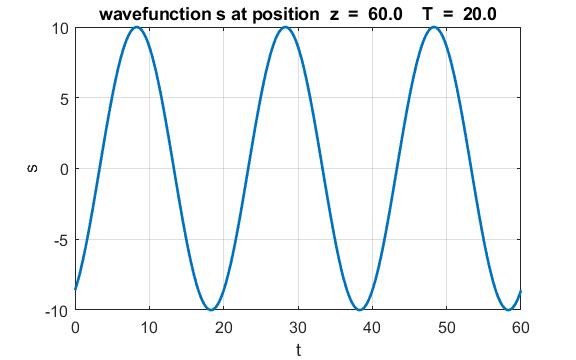
whereas the particle velocities vary both in direction and time. · The variation is both space and
time are displayed in the animations and the concepts of wavelength and
period can be easily presented. · The connection between the wave
velocity and other parameters can be easy deduced from the animations. · The phase of the wave in both space
and time are displayed. Only the particles which are separated by integer
multipes of a wavelength vibrate in phase. |
|
ANIMATED GIFS |
|
|
|
|

|
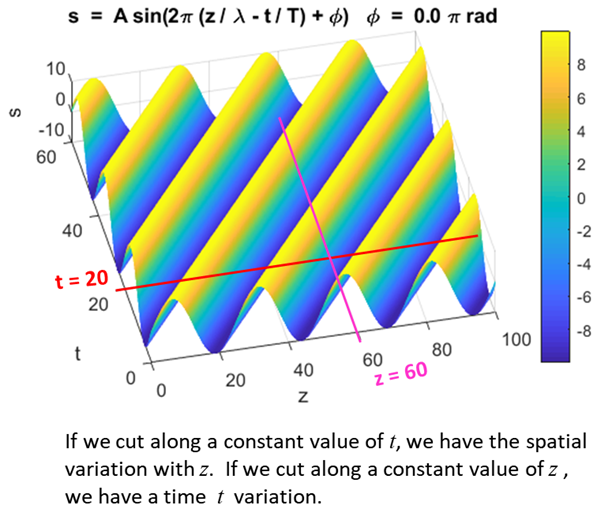
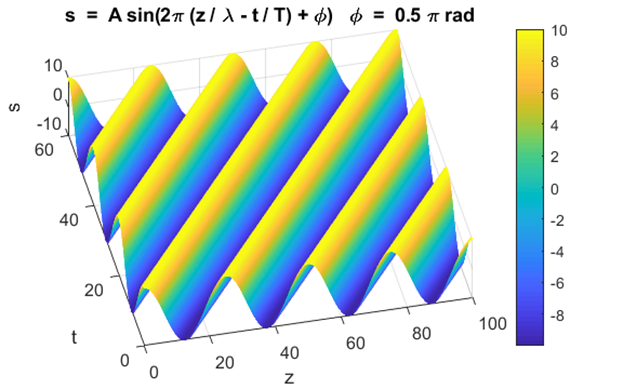
[3D] view of a one-dimensional wave propagating
in the Z direction A [3D] view of a
one-dimensional wave propagating in the Z direction which is described by the
wavefunction wm_ttw2.m. The first-dimension corresponds to time t, the second-dimension to z and the third-dimension, the value
of the wavefunction
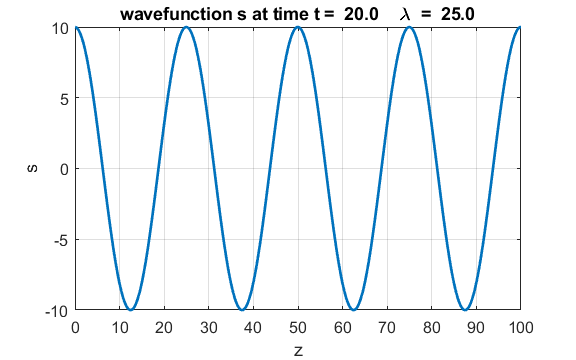
Changing the phase f shift the positions of the crests
and troughs.
|
|
John A Sims john.sims@ufabc.edu.br Universidade Federal do ABC
http://www.ufabc.edu.br/
Biomedical Engineering Department,
Centro de Engenharia, Modelagem
e Ciencias Sociais Aplicadas.
(Centre for Engineering, modelling and applied social sciences) Rua Arcturus (Jd Antares) Anchieta
09606070 - Sao Bernardo do Campo, SP - Brasil Ian Cooper matlabvisualphysics@gmail.com
|