|
1: Kinematics P10003.m The acceleration and braking capabilities of
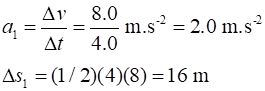
a new car are being tested. The driver accelerates from rest to 8.0 m.s-1 for 4.0 s. The driver then travels at a
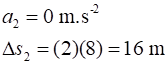
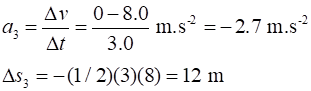
constant velocity for 2.0 s and then, by applying the brakes with an even
pressure, stops the car in 3.0 s. Draw a v / t graph for the motion of the
car. From the data given in the questions, what
are all the interesting things that you can calculate? View solution below only after you have completed the answering the question. |
|
Solution
The slope of the tangent to the v/t graph
equals the acceleration. Area under v/t graph gives the displacement. (1) interval 0 s to 4 .0 s
(2) interval 4.0 s to 6 .0 s (3) interval 6.0 s to 9 .0 s The total displacement of the car from its
starting position is |
|
VISUAL PHYSICS ONLINE If you have any feedback, comments,
suggestions or corrections please email: Ian Cooper
School of Physics University
of Sydney ian.cooper@sydney.edu.au |