|
1 KINEMATICS P10 005 The
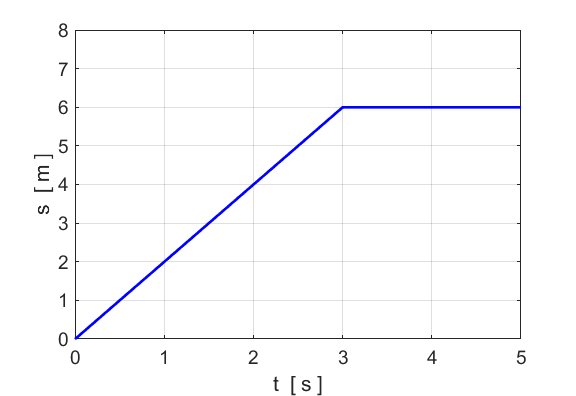
graph plots the displacement against time graph for an object moving in a
straight line. Fully describe the motion of the object in the 5.0 s time
interval. Your answer should include all numerical values.
View solution below only after you have completed the answering the question. |
|
Solution Assume
the motion of the object is along the X axis. The slope of the tangent to the displacement verses time graph gives the velocity.
For the first 3.0 s, the slope of the graph is a straight line with a slope of 2.0 m.s-1. Therefore, in the first 3.0 s the object moves with a constant velocity of 2.0 m.s-1 in the +X direction. For the time interval, t = 3.0 s to t = 5.0 s, the slope of the line is zero. Therefore, the object is at rest for the time interval from t = 3.0 s to t = 5.0 s. The final displacement of the object after 5.0 s is 6.0 m in the +X direction |
|
VISUAL PHYSICS ONLINE If you have any feedback, comments,
suggestions or corrections please email: Ian Cooper
School of Physics University
of Sydney ian.cooper@sydney.edu.au |
