|
VISUAL PHYSICS ONLINE 3.1
WAVES P31 005.m An experiment
was conducted to investigate the relationship between the frequency f of vibration of a stretched string vibrating
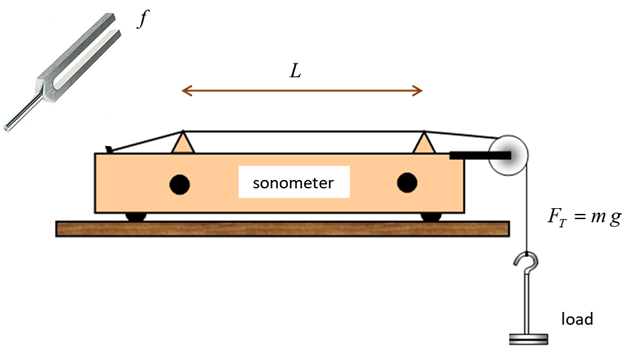
in its fundamental mode and the length of the string L between the two bridges. A sonometer was used for the experiment.
The string
tension FT was adjusted until the vibrating string
between the movable bridges gave the same note as the vibrating tuning fork.
The tension was then held constant and the experimented repeated for several
different tuning forks. Each time, the distance between the bridges was
adjusted until the fundamental mode of vibration was setup in the string. The
results were: frequency f [Hz] 125
256
320 384
512 Length L [m]
0.790
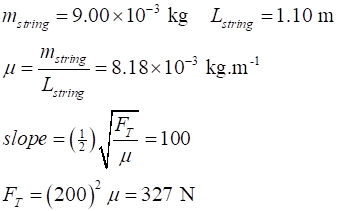
0.390 0.312 0.263 0.193 The mass of the
string was 9.00 g and its length was 1.10 m. Draw a graph of
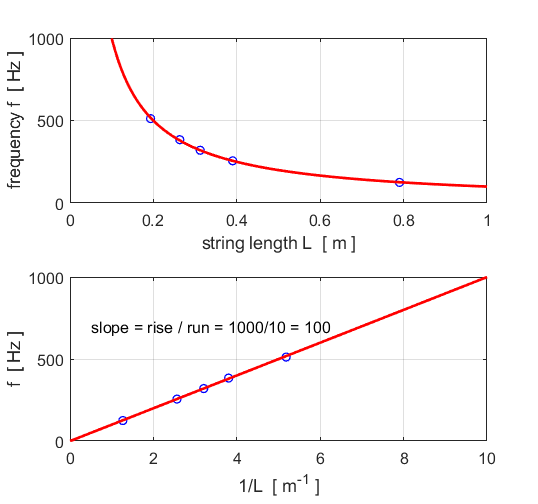
the frequency (Y axis) against L (X axis). Draw a graph of
the results such that a straight-line graph is obtained. From the
straight-line graph, determine the string tension FT. Outline an
experiment that you could perform to investigate the relationship between the
fundamental frequency f
and the string
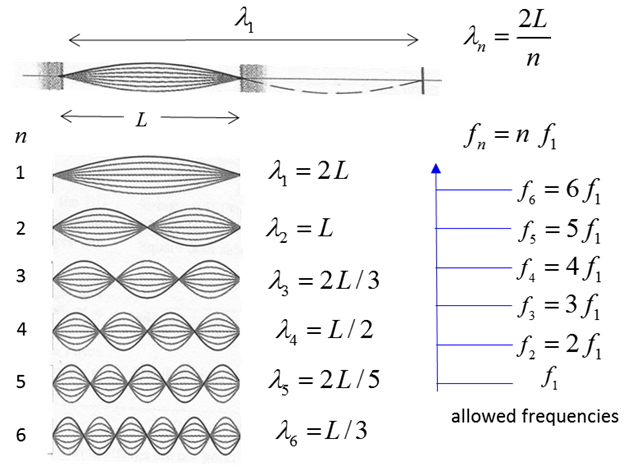
tension FT. Sketch the
shape of the vibrating string between the two bridges for the first six
harmonics. View solution below only after you have completed the answering the question. |
|
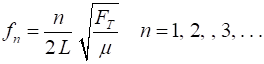
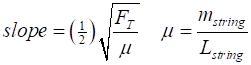
Solution The frequency of the normal modes of vibration of a string fixed at both ends is For the fundamental mode n = 1. For our frequency and length data, a plot of the graph of f against 1/L should be a straight line passing through the Origin. The slope of the line should be
The blue circles show the data and the red lines are the curves of best fit. The plot of f against 1/L is a straight line through the Origin, which is agreement with our theoretical prediction.
To investigate the relationship between the frequency f of the fundamental mode and the
string tension FT
it is necessary to keep the length L between the two bridges of the
sonometer fixed. From the measurements of f
and FT, you would plot the graph of f against FT. To test our theoretical prediction,
a straight line graph is necessary. Therefore, you could plot f against
|