|
VISUAL PHYSICS ONLINE 4.1 ELECTRICITY P41 0005 You carried out an experiment in which the
potential difference between the two ends of a conducting wire varied with
respect to the current flowing through the wire. The following measurements were
recorded.
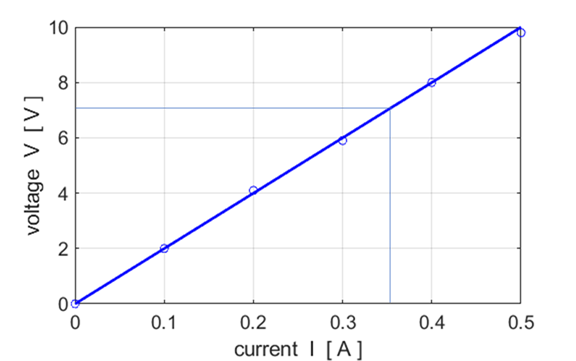
V (V) 0 2.0 4.1 5.9 8.0 10.0
I (A)
0 0.1 0.2 0.3 0.4 0.5 a Plot a graph
of V versus I [I on x-axis, V on
y-axis] b What
is the slope of the graph and what does it represent? c Use the graph
to determine the potential difference across the conducting wire when a
current of 0.35 A flows through it. View solution below only after you have completed the answering the question. |
|
Solution a
b The slope
of the graph, m is the change in potential
difference with change in current or You could
choose any two points on the line of best fit, but it makes it easier of they
are far apart rather than close together. The slope represents the resistance
of the wire. R = 20 c See the
plot above. When a current of 0.35 A flows there will be a potential
difference of 7.0 V across the wire. |