|
THE NEED FOR MEASUREMENT
Ian Cooper email: matlabvisulaphysics@gmail.com
RELIABILITY OF MEASUREMENT
There are three purposes in considering the reliability of measurements: 1 Comparison with other results. 2 Comparison of a measured quantity with a theoretical prediction. 3 A piece of experimental data may be required for the design of some apparatus or procedure e.g. an engineer needs to know how much confidence he can place in the values of the strength of materials in the construction of a bridge.
A measurement is the result of some process of observation or experiment. The aim of any measurement is to estimate the ‘true’ value of some quantity. However, we can never know the ‘true’ value and so there is always some uncertainty that is associated with measurement (except for simple counting processes).
A rough method of indicating the degree of uncertainty in a measurement is through the number of significant figures. The usual convention is to quote no more than one uncertain figure. For example, g = 9.81 m.s-2 the digit 1 is in doubt and g is expressed to 3 significant figures.
A better method of indicating uncertainty in a measurement is to quote it explicitly e.g. the length of the box is (10.00 ± 0.05) mm. This means that we are reasonably confident that the length of the box is between 9.95 to 10.05 mm. N.B. the value for the measurement and its uncertainty are quoted to the same number of decimal places and not the same number of significant figures. As a rule, only or possibly two significant figures are given for the uncertainty.
A scientific value (physical quantity) thus needs four Parts: name and/or symbol value uncertainty unit
There are many sources of uncertainty (errors) in measurements. Often, we consider only two categories: random errors and systematic errors.
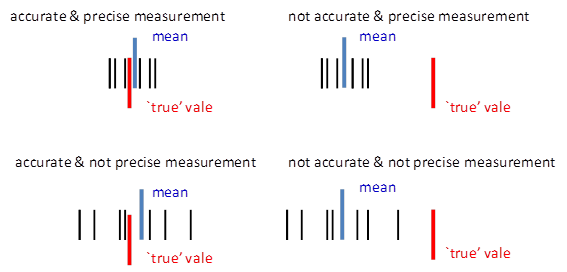
Random errors arise through repeated measurements of the same physical quantity. The random error gives the precision of a measurement. The smaller the random error then the better the precision
Precision is the reproducibility of a measurement under identical circumstances. It has nothing to do with correctness, an incorrect result can be highly reproducible.
Systematic errors are inherent in the system and can’t be removed or even detected through repeated measurements. The systematic error gives the accuracy of the measurement. The smaller the systematic error then the better the accuracy
Accuracy refers to the correctness of a measurement or absence of bias.
Systematic errors shift the randomly spread readings away from the ‘true’ value and so no matter how many readings are taken, the final result will not approach the ‘true’ value. Random errors are dealt with statistically whereas systematic errors are tricky and they depend largely on the equipment used and on the skill and techniques of the experimenter.
Thus, the uncertainty in a measurement depends upon both the random errors and systematic errors.
Examples of systematic errors
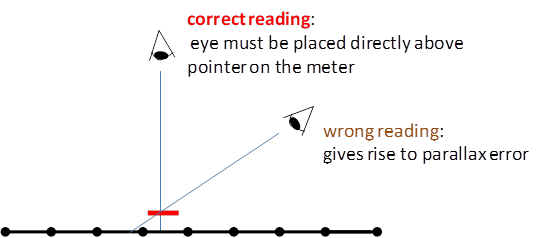
Human Error Many errors arise in the actual process of human observation such as reaction time in using a stopwatch or a parallax error in reading an analogue meter. Repeated readings of the same quantity often reveal this type of mistake. It is more difficult to detect an error in technique which leads to all the repeated readings being biased in the same way.
Instrument Limitations Instruments vary markedly in quality, some are designed better than others and incorporate better workmanship and components. The accuracy of a micrometer depends on the uniformity of the screw thread. Many electrical meters used in schools have are accurate of more than 3%. For example, a voltmeter has an accuracy of 3% and a voltage of 10.0 V is recorded. This implies that the ‘true’ reading is not 10.0 V but lies in the range 9.7 V to 10.3 V.
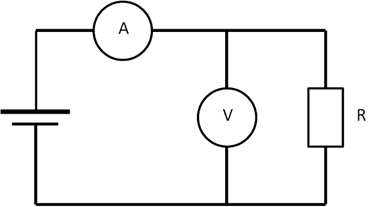
Not measuring what you thought you measured Current flows from the battery through the ammeter A and then splits, some going through the voltmeter V and some going through the resistor R, before re-joining and flowing back to the battery. The ammeter reading A is often used to measure the current through the resistance R.
Zero errors An instrument may not be zeroed, and therefore you should make a correction for this. You should not make corrections for zero errors in your head. Always record the actual instrument reading, and apply the correction separately.
Calibration Errors It is often necessary to calibrate an instrument. This can be by careful comparison of the instrument with those obtained on an instrument known to be accurate.
Example An ammeter was used to measure the current through a resistor. Recorded results: Zero reading: -0.03 A Calibration factor: 0.90 (linear) Instrument reading: 1.06 A Corrected reading: (1.06 + 0.03)(0.9) A = 0.98 A
Extraneous influences Often an experiment goes wrong because the quantity being measured is influenced by extraneous influences. For example, an electronic top pan balance is sensitive to movement in the room; expansion of a metal ruler due to an increase in temperature; impurities present when doing a chemical test.
Disturbances caused by the act of observation The very act of making an observation or measurement can alter the situation being studied. For example, the study of animals under controlled conditions; the measurement of tyre pressure with a gauge; immersion of a cold thermometer in a beaker of hot liquid; micrometer squashes paper when measuring the thickness.
No observation can be made without altering what is being observed. Even when an object is simply illuminated in order to look at it - the light exerts a force on it and alters the state of the object being measured.
In the theory of Newtonian mechanics, it is assumed that one can measure the position and momentum of a particle exactly. However, this assumption fails when applied to atomic systems. The better the position of a particle is known then the greater the uncertainty in the momentum of the particle. This idea is one form of the Heisenberg Uncertainty Principle.
RANDOM ERRORS AND PRECISION
The resolution is a statement about the precision of a measurement. The resolution depends on: · the graduation of the instrument · the physical quantity to be measured · the care and skill of the observer.
In general limits of resolution are significant only when only one reading has been taken or when repeated readings are all identical. The resolution should not be taken as ± half the smallest scale division on an instrument as is often stated. Instead you should quote the amount by which the reading would have to change before you could notice that change and think about how many digits are significant in the measurement. For example, you want to measure the width of an A4 page with a rule graduated in millimetres. The resolution is not ± 0.5 mm (half the smallest scale division) but about 1 mm because of the difficulty of aligning the ruler with the page.
The process of duplicating measurements is at the heart of any experimental process. Usually when you take a set of measurements there are fluctuations in the results, i.e., not all recordings are the same. If the fluctuations in the measurements are small then the precision said to be good.
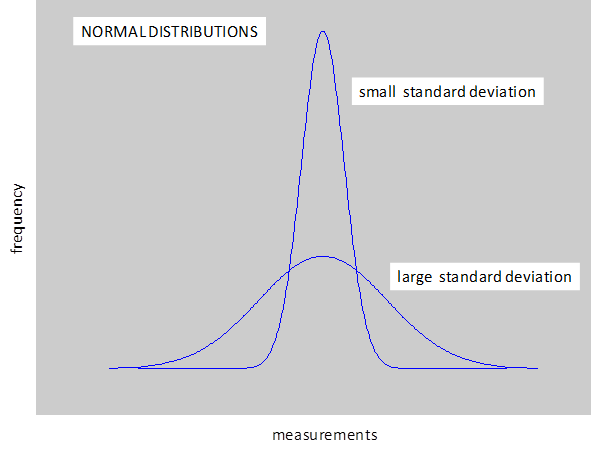
We usually assume that the variation in the measurements is described by a normal distribution. For large data sets the normal distribution is shown graphically as a bell shape curve with the X-axis corresponding to the measurements and the Y-axis to the frequency of each measurement. The mean corresponds to the peak in the curve because most measurements are centred about the mean value. The curve is symmetrical about the mean and very few measurements are far from the mean. Examples of normal distribution include the heights of all adults in Australia and the marks of students doing their final high school examination.
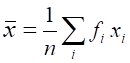
The best estimate of the measurement is usually taken as the mean (average) value.
If the set of measurements are
where
The precision depends upon the spread of
the measurements about the mean value. The spread can be measured by taking
the maximum deviation of all measurements from the mean. This quantity
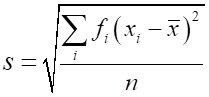
The standard deviation
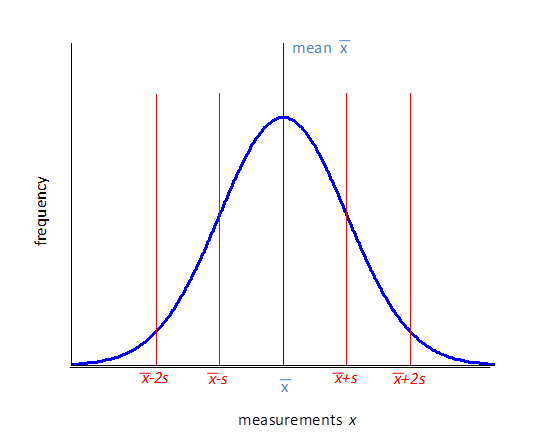
If the measurements are described by a normal distribution (large number of readings) then you can conclude that: 68%
of the individual readings are in the range 95%
of the individual readings are in the range 99.7% of the
individual readings are in the range
There are several ways which are scientifically acceptable in recording a measurement for random errors. · Quoting the correct number of significant figures e.g.
mean voltage
· Quoting the range of measurements from the extreme values e.g.
mean voltage
· Quoting the standard deviation e.g.
mean voltage
EXAMPLE Image that you perform an experiment to
measure the acceleration due to gravity
Below are ways in which students might
have recorded their measurement of
Student 1
incorrect – no units and too many significant figures
Student 2
correct - – units and appropriate number of s. f. the digit 6 is in doubt
In the above cases, the measurements recorded do not agree with the acceptable value. Therefore, it is difficult to come to a scientific conclusion in comparing the recording with the acceptable value.
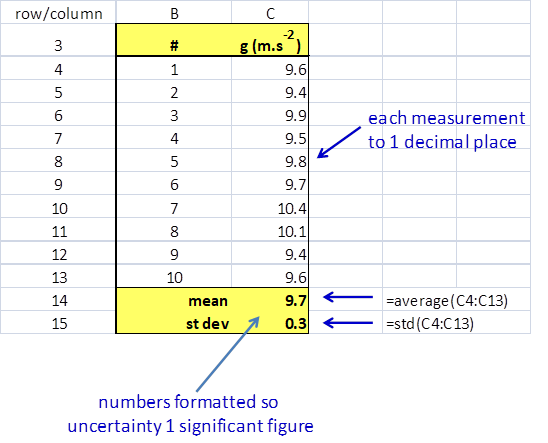
Student 3 – entered the data in MS EXCEL spreadsheet A good method to analyse experimental data is to use a spreadsheet. You can use the spreadsheet to perform many calculations such as finding the mean (average) and the standard deviation as shown in below.
From the spreadsheet: mean = 9.8 m.s-2 standard deviation = 0.4 m.s-2 max deviation from mean = 0.6 m.s-2 The result can be recorded as
These two ways of writing the
measurement of
Sample spreadsheet
|