|
|
WAVES SUPERPOSITION
PRINCIPLE DIFFRACTION INTERFERENCE |
|
Particles and waves carry energy from one place
to another. Both particles and waves can be reflected and refracted. So, what characteristics distinguish waves from particles? Two rocks cant be in the same place at the
same time. However, multiple waves can occupy the same space at the same
time. When more than one wave occupies
the same space, at each instant a resultant wave form is produced which is
simply the algebraic sum of the individual wavefunctions.
This concept is known as the Superposition Principle. For example, two
pulses travelling in opposite directions will pass through each other
unaffected, while passing, through each other, the resultant displacement is
simply the sum of the individual displacements. The superposition principle can be used to
describe the interference
and diffraction
behaviour of waves. In the classical
view of the universe, particles do not obey the superposition principle,
hence, particles do not interfere with each other and do not undergo
diffraction. But our universe is much more interesting at the atomic level.
Using the concepts of quantum mechanics, waves have particle like properties
and particles have wave like properties. This is known as the Wave-Particle
Duality Principle. Experiments show that particles such as
electrons can be assigned a wavelength and can produce diffraction patterns.
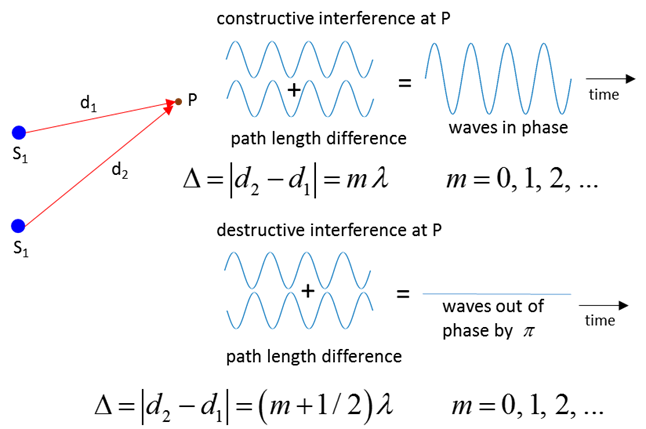
These ideas will be explored more deeply in later Modules. Applying the superposition principle when
the crest of one wave overlaps the crest of another wave, their individual
effects add together to produce a wave of greater amplitude. This is called constructive
interference. When the crest of one wave overlaps the trough of
another, the amplitude of the resultant wave is reduced. This is called destructive
interference. |
|
Thinking
exercise Predict Observe Explain POE Carefully view the set of animations of the
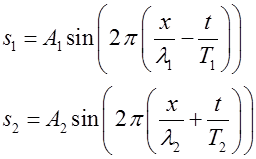
overlapping two [1D] sinusoidal waves travelling in opposite directions and
interfering with each. The equation describing the two wave functions are
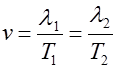
The speed of propagation is fixed by
the properties of the medium, therefore,
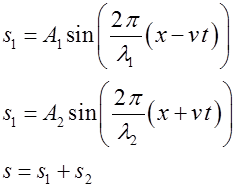
Therefore, the wavefunctions
#1, #2 and resultant wavefunction can be expressed
as Predict how the two
waves interfere with each other, Observe
the animations and Explain
any discrepancies. For each animation, estimate for wave #1,
wave #2 and the resultant wave (wave #3): amplitude, wavelength, period,
frequency and speed of propagation. |
|
Animation 1. |
|
Animation 2. |
|
Animation 3. |
|
POE summary The
two pulses travelling in opposite directions will pass through each other
unaffected, while passing, through each other, the resultant displacement is
simply the sum of the individual displacements. Animation 1. wave #1
wave #2
wave # You get a surprising result when the two
waves have identical speeds, amplitudes, wavelengths and periods. The waves
are steadily in and out of phase with each other. The
waveform is stationary the speed of propagation is zero. Such a wave
is called a standing
wave (stationary wave). There are nodes
where there is complete cancellation with zero energy and antinodes
where there is a maximum reinforcement of the waves and maximum energy. For a
standing wave, the positions of the nodes and antinodes is fixed, that is,
their positions are independent of time. Standing waves are setup in the strings of
musical instruments when plucked, bowed or struck. The initial disturbance
travels along the string and reflected at the ends. Standing waves are formed
at certain frequencies of vibration by the reflections of the waves as they
move backward and forward along the string and interfere with each
other. Standing waves are formed in
wind musical instruments such organ pipes, trumpets, and clarinet by reflections
of the sound waves in the pipe of the instruments. Animation 2. wave #1
wave #2
wave #3 The resultant wave is a sinusoidal wave
moving to the right at 2.0 m.s-1. Animation 3. wave #1
wave #2
wave #3 The resultant wave is a complex wave moving to the right at 2.0 m.s-1. |
|
Huygens
Principle When you make a sound in the kitchen, the sound
spreads in all directions away from you. It's easy to think about the sound
waves as if they just move in a straight line but this is not true another
person in the dining room can hear the sound from the kitchen the wave
heading toward the door into the dining room goes through that door, and
again spreads in all directions enabling you to hear the sound. This behaviour of waves was studies in 1678
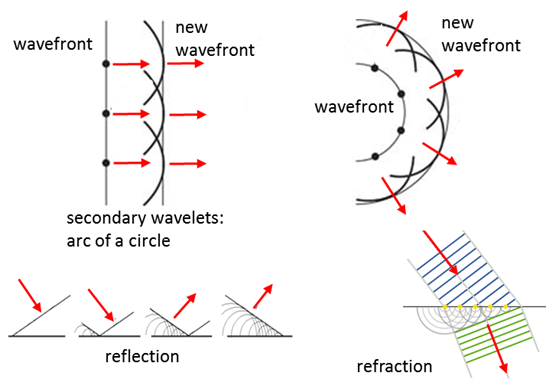
by the Dutch physicist, Christian Huygens. Huygens
Principle -
every point of a wavefront may be considered the source of secondary wavelets
that spread out in all directions with a speed equal to the speed of
propagation of the waves.
Fig. 1. Huygens principle can be used to
determine the path of a wavefront (plane wave, circular wave, reflected wave,
refracted wave, etc) by drawing a set of arcs of
circles from the old to the new wavefront. |
|
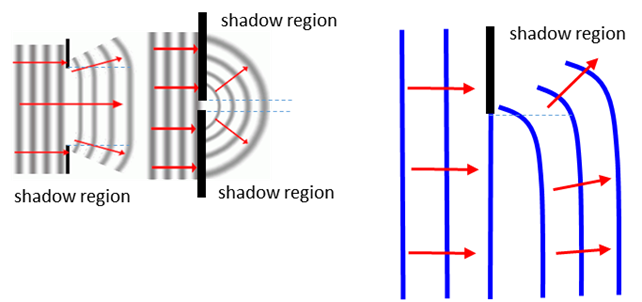
Diffraction Any bending of light by means other than
reflection or diffraction is called diffraction. Diffraction occurs when a wave
passes through an opening, around an edge or around an obstacle. Figure 2
shows sketches for the diffraction due to an opening and an edge.
Fig. 2. A wave bends and
spreads as it passes an edge. Why can we hear
around corners, but cant see around corners?
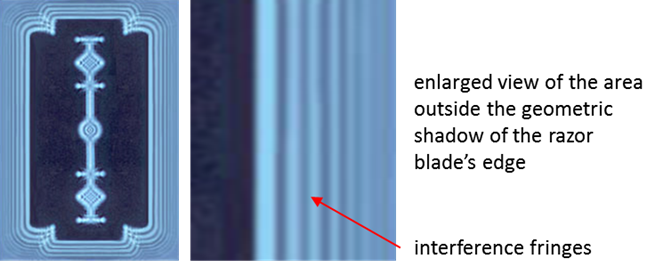
Fig.3.
When waves bend around an edge, they can also interfere. A photograph
of a razor blade illuminated by a monochromatic (single wavelength) source.
Notice the interference
fringes around the outline of
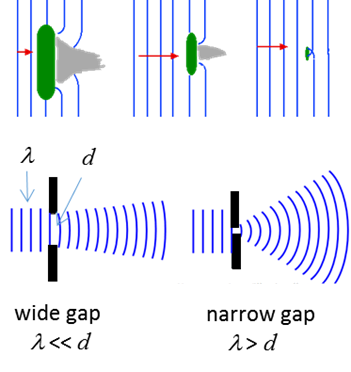
the blade. The amount of diffraction depends on the wavelength
of the wave compared with the size of the obstacle that casts a shadow as
shown in figure 4. Wavelengths much greater the dimensions of the obstacle
diffract more - they fill in the shadow regions. On the other hand, for waves
with wavelengths much smaller than the obstacle, there is little bending and
there are definite shadow regions.
Fig. 4. The amount of diffraction depends on the
wavelength of the wave compared with the size of the obstacle that casts a
shadow. AM radio signals are relative long
wavelengths (~200 to ~600 m) and these waves readily bend around buildings
and other obstructions. A long-wavelength radio wave doesnt see a relatively
small building in its path, but a short wavelength radio wave does. The FM
band radio waves have short wavelength (2.8 to 3.4 m) and dont bend around
buildings very well. Driving through the city, you will notice a AM radio
station has a much better reception than an FM radio station. When a wave passes through an
aperture, the wave spread because each point on the wavefront can be consider
a set of point sources, each radiating in all directions beyond the aperture
this is diffraction.
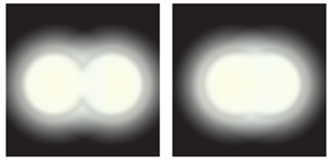
This causes serious problems for telescopes and microscopes. So, when you use
a telescope to image two stars close together, the light entering the
microscope is diffracted a point object becomes a blurred circle and this
makes it difficult to distinguish two stars as separate identities if they
are too close together.
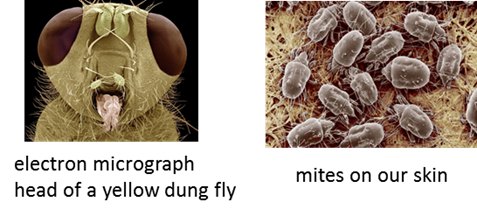
The image of two stars? In viewing an image with a microscope,
if the size of the object is about the same as the wavelength of light,
diffraction blurs the image of the object. If the object is smaller than the
wavelength, no structure can be seen the image is lost because of
diffraction. To obtain clear images of very small objects, electron
microscopes are used. Highly energetic electrons (electron do have wave-like
properties) have much smaller wavelengths than visible light and so very
small objects can be imaged. Magnetic fields and electric fields are used as
lenses to focus electron beams to get the highly magnify images of small
objects.
|
|
Modelling
[2D] Waves We can model [2D] waves (e.g. surface waves
on water) to visual their behaviour through a set of animations. A number of mechanical vibrators produce disturbances at a
fixed frequency. The waves then spread in all directions from the sources.
The speed of propagation of the waves is constant and is determined by the
properties of the medium. For the animations, the frequency of the sources is
set at 100 Hz and the propagation speed is 25 m.s-1. |
|
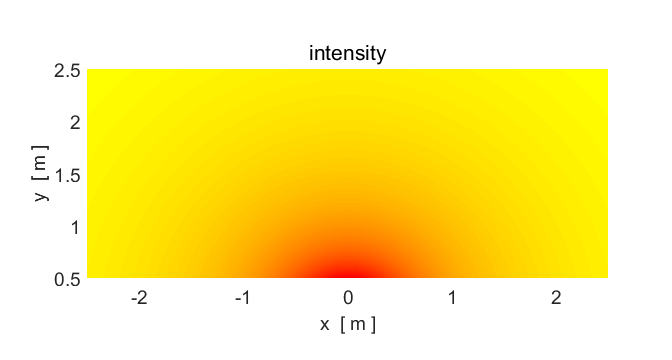
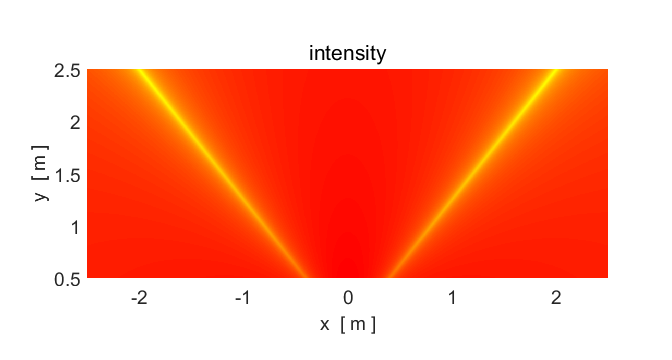
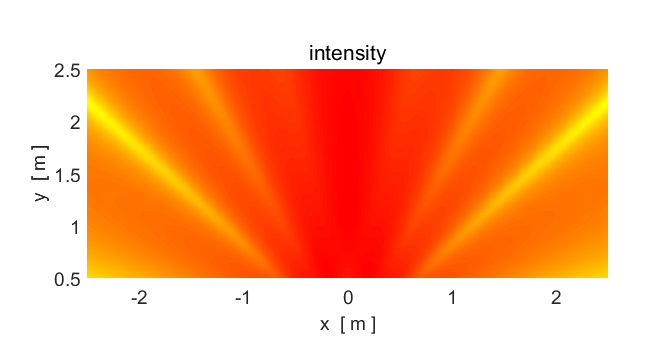
Animation 4. A point source produces waves spreading in
all directions with circular wavefronts. The source frequency is 100 Hz (T = 0.0100 s). The speed of propagation is
25.0 m.s-1 and the wavelength is 0.25 m. The
green regions are the crests and the blue are the troughs. In the intensity
plot, red is high intensity and yellow low. Notice that the intensity (and
amplitude) of the wave decreases away from the source. In [3D] the intensity
falls as 1/r2
(amplitude falls as 1/r)
inverse
square law. The source is located at the origin (0, 0). The
amplitude of the wave from the point source goes to infinity as the distance
between the observation point and the source goes to zero. So, in the plots,
the wave amplitude can only be calculated for points well away from the
source point. |
|
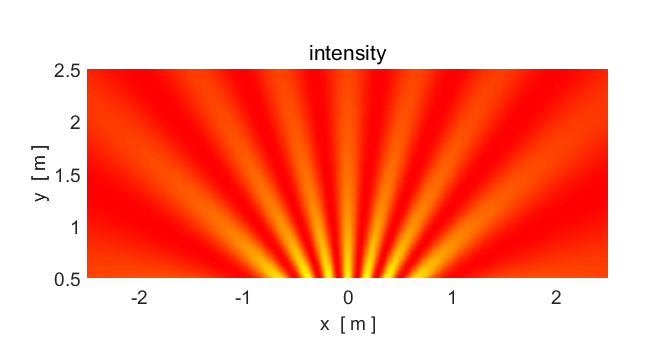
We will now consider two sources. In some places
crests overlap crests (constructive interference) and in other places crests
and troughs overlap (destructive interference).
Animation #5 shows the interference pattern
from two sources.
Animation 5A. The spacing of the sources is
Animation 5B. The spacing of the sources is Location of sources: (-0.1 m, 0) and (-0.1
m, 0).
Sound (two speakers): if you walked along a
nodal line, the sound would be very quiet but very loud along an antinodal line.
Light (two red lasers): nodal regions would be
dark and antinodal regions bright. |
|
Diffraction
from single apertures We know that when a wave passes through an
opening, the waves spread in all directions diffraction. However, if we
think about Huygens
Principle, each point in the opening acts like a source of
secondary waves which emit waves that spread out beyond the aperture. So, at
certain points, these secondary waves may be in phase and interfere
constructively, while at other points the waves maybe out of phase and
interfere destructively. Therefore, when a wave passes through an opening a
diffraction pattern maybe produced with distinctive regions of reinforcement
(constructive interference) and regions of cancellation (destructive
interference).
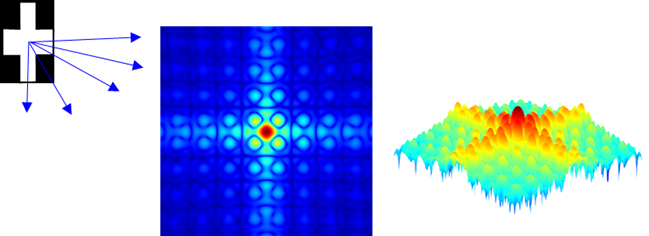
Fig. 5. Light passing through a cross-shaped
aperture spreads and interferes to produce a diffraction pattern on a
distance screen. The diffraction patterns shown correspond to the intensity
of the light on the viewing screen using false colours. Regions of bright and
dark are clearly seen in the plots.
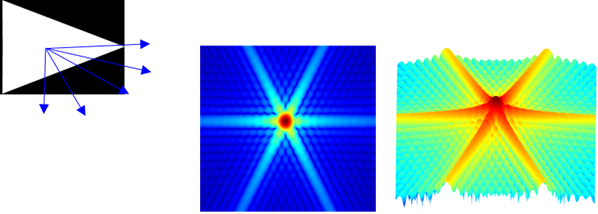
Fig. 6. Light passing through a triangular-shaped
aperture spreads and interferes to produce a diffraction pattern on a
distance screen. The diffraction patterns shown correspond to the intensity
of the light on the viewing screen using false colours. Regions of bright and
dark are clearly seen in the plots.
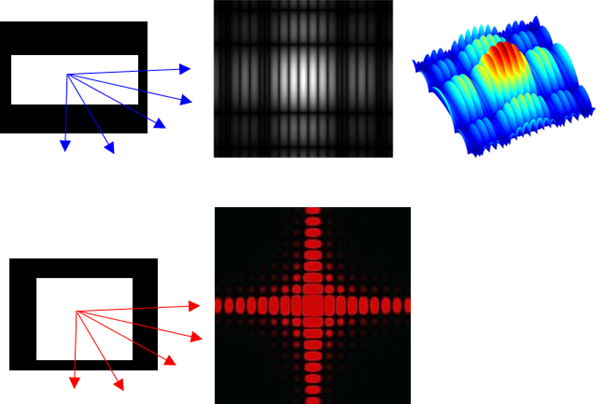
Fig. 7. Light passing through a rectangular-shaped
aperture spreads and interferes to produce a diffraction pattern on a
distance screen. The diffraction patterns shown correspond to the intensity
of the light on the viewing screen using false colours. Regions of bright and
dark are clearly seen in the plots.
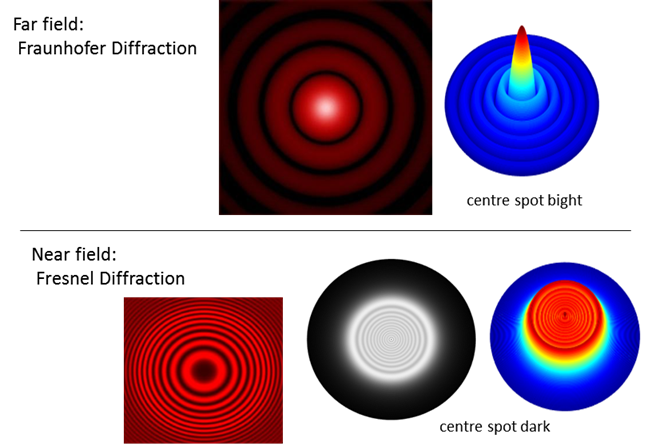
Fig. 8. Light passing through a circular aperture. If the viewing screen is a large distance from the aperture, we get a Fraunhofer diffraction pattern. If the viewing screen is near the aperture, the energy distribution becomes very irregular and unexpectantly, you can observe a dark spot at the centre of the image. This type of diffraction is called Fresnel diffraction. |
|
Diffraction
from a single slit
Animation 6. Diffraction of water waves through an
aperture of width Single slit
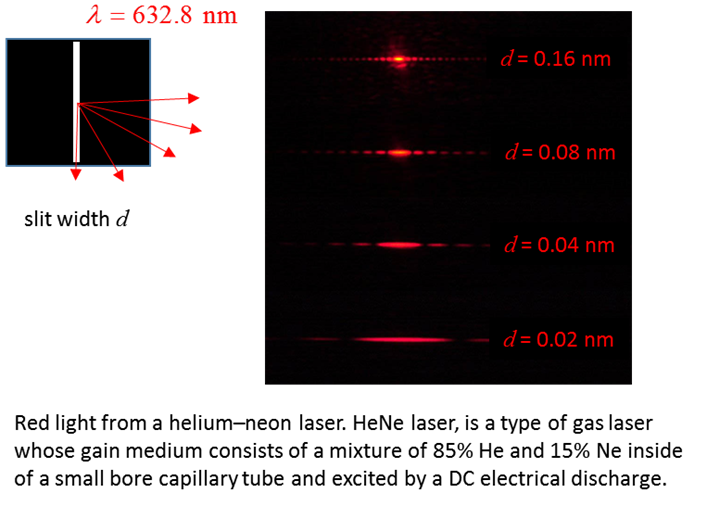
diffraction with visible light Consider
monochromatic light of wavelength
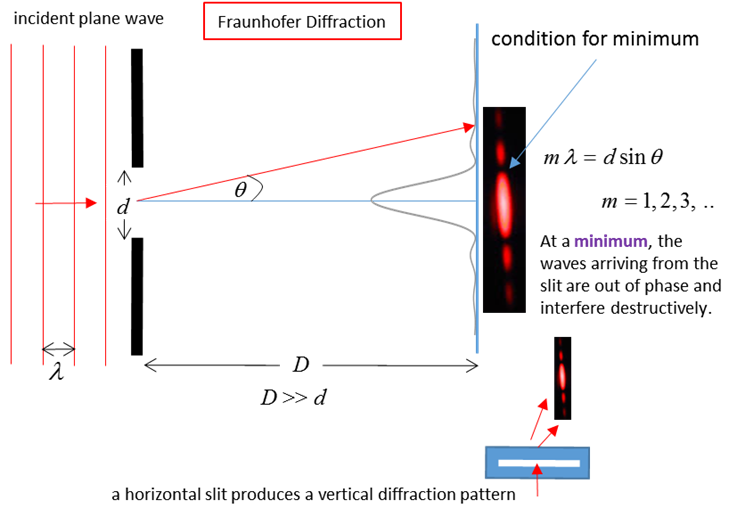
Fig. 9. Single-slit diffraction. When light of
wavelength After
passing the slit, the light is observed on a distant screen xxxxxxxxxx The position of the first order dark fringe
xxxxxxxxxx We know that the sine of angle cant be
greater than 1
Fig. 10. Red light passing through a narrow slit.
N.B. the smaller the width d of the slit the broader the
diffraction pattern.
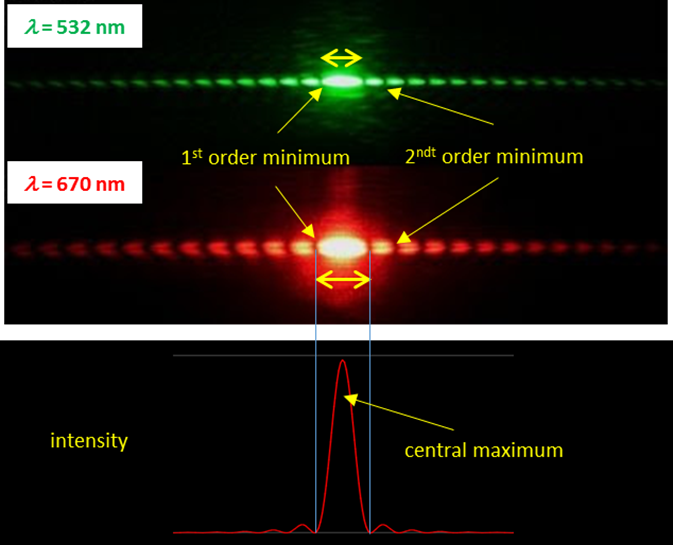
Fig. 11. Photographs of the
diffraction for a single slit using green
and red lasers. The diffraction pattern shows
a strong central maximum (bright spot) surrounded by secondary maxima of much
lower intensity. The dark fringes are identified by specify their order, m = 1, 2, 3, N.B. the larger the wavelength, the
wider the pattern. |

|
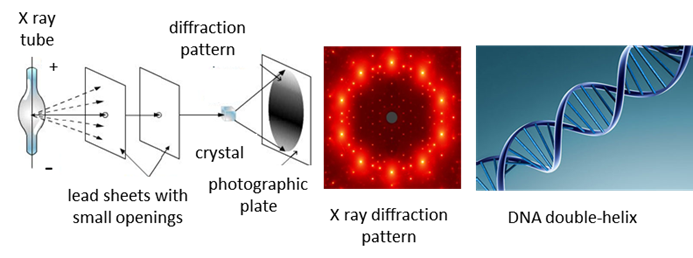
Diffraction
in the real world A key characteristic of a crystal is that
it has a regular repeating structure of molecules arranged in planes. When
such a crystal is exposed to electromagnetic radiation a diffraction pattern
can be generated provided the wavelength of the radiation is comparable to
the spacing d between the parallel planes within the
crystal. Typically,
Fig. 12. X ray
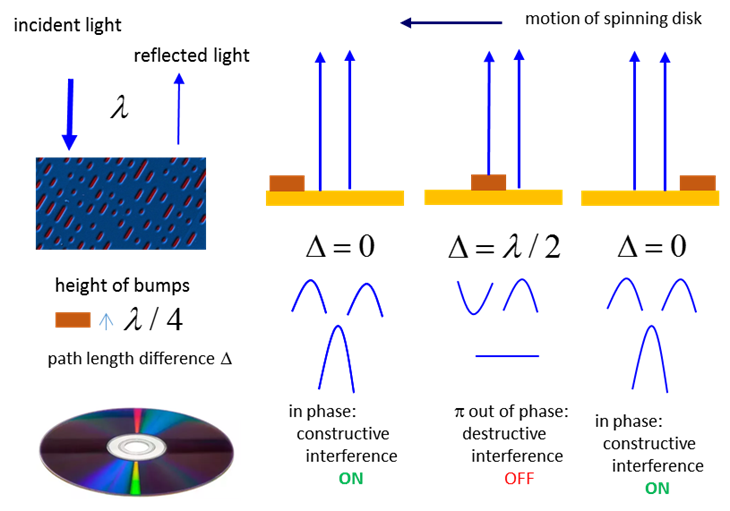
diffraction. Destructive / constructive interference
plays a key role in the operation of a CD. A series of bumps are encoded on a
smooth reflecting surface. A laser beam is reflected off the reflective
surface to a detector. As a bump moves through the laser beam, the detector
either receives a weak off signal or a strong on signal depending upon
the whether the reflections are out of phase (destructive interference) or in
phase (constructive interference) as shown in figure 13.
Fig. 13. Reading information
on a CD. |
|
Interference
Youngs Double Slit Experiment Thomas Young: English physician and scientist 1773
1829. He was a bright guy - by age of 2 he could read fluently, by 4 he had
read the bible twice and at 14 he knew eight languages. In 1801 Thomas Young, through his experiments provided
convincing evidence for the wave nature of light and was even able to measure
the wavelength for visible light.
Before this, the nature of light was not clear. Newtons view was that
light corresponded to a stream of particles. We now know that Newton was not
untirely wrong light has a dual nature, it behaves as a particle or a
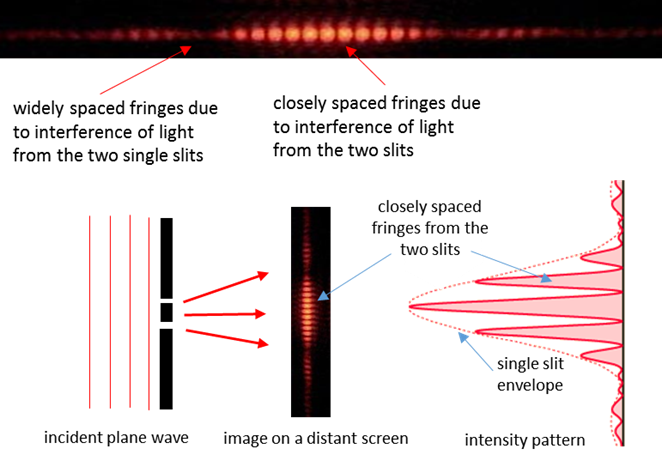
wave. Young found that light directed through two
closely spaced pin holes recombines to produce fringes of brightness and
darkness on a screen. Young could explain this result as a wave interference
phenomenon. The light from each pin hole produces an interference pattern and
the light from the two separate pin holes also interfere. Bright spots are where the waves are in
phase and reinforce each other constructive interference. The waves are out
of phase at the positions of the dark fringes and cancel each other
destructive interference. The interference of light from two slits is
shown in figure 14. Notice, the interference pattern from the two slits is not
the superposition of the diffraction patterns from each slit.
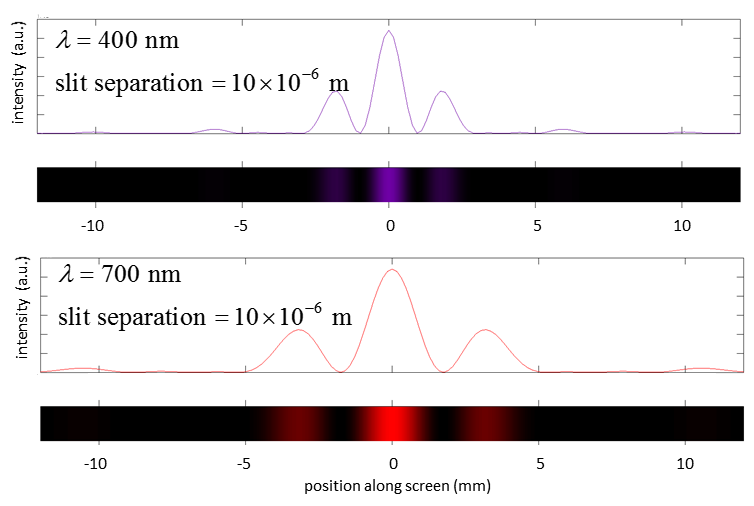
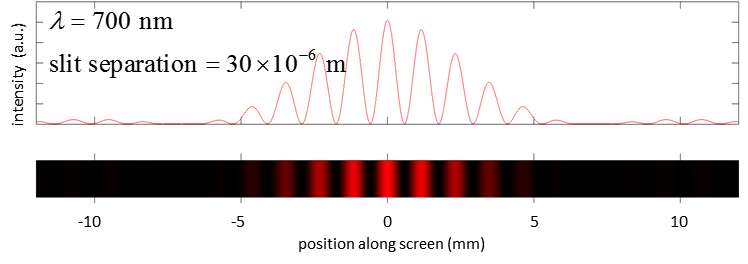
Fig. 14. Interferecen from double slits. Figure 15 shows a computer stimulation for the interference
of violet and red light from a pair of slits. Notice, the greater the
wavelength, the wider the the sparation of the slits and the greater the
distance between the pair of slits the closer the spacing between the
fringes.
Fig. 15. Computer simulation of the interference
fringes produced by a double slit experiment. |
|
Ian Cooper Honorary
Lecturer, School of Physics, University of Sydney ian.cooper@sydney.edu.au If you have any comments, suggestions or corrections please email Ian Cooper |