|
EVOLUTION OF STARS HERTZSPRUNG-RUSSELL DIAGRAM The total power radiated by a star is called its
intrinsic luminosity
L. The apparent
brightness or apparent
luminosity b of a star as observed on Earth is the
intensity of the light at the Earths surface which is perpendicular to the
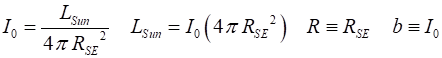
path of the light. If a star of luminosity L is at a distance R from the
Earth, then its apparent brightness b is ignoring any absorption in space and if the power
radiated by the star will be spread over a sphere of surface area The absolute magnitude
of a celestial object is a measure of its luminosity (visual brightness) on a
logarithmic astronomical magnitude scale. The more luminous an object, the
smaller the numerical value of its absolute magnitude. A difference of n in the
absolute magnitude of two stars corresponds to a luminosity ratio of 100n/5. For
example n = 5, a star of absolute magnitude MV = 3 would be 100 times more
luminous than a star of absolute magnitude MV = 8 as
measured in the V filter band (visible range 700 nm to 400 nm). The Sun has
absolute magnitude MV = +4.83. Another important parameter of a star is its surface
temperature T. The surface
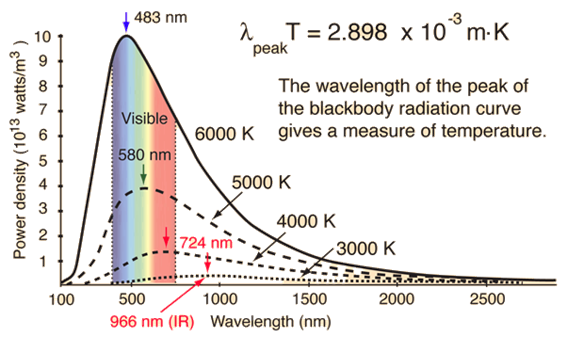
temperature T of a star is determined from the peak
wavelength The surface temperatures of stars typically range
from about 3 000 K (reddish) to about 50 000 K (UV).
Fig.
1. Blackbody radiation curves. The standard spectral class classification scheme of stars is based on temperature. Most
stars fit into one of the following types or spectral classes: O, B, A, F, G,
K, M. These classes go from hot to cool with O the hottest and M, cool. |

|
Spectral Type |
Surface Temperature [K] Colour |
Spectral lines |
|
O |
> 28 000 blue |
He+ lines strong UV continuum |
|
B |
10 000 28 000 blue-white |
neutral He lines |
|
A |
7 500 10 000 white |
strong H lines ionised metal lines |
|
F |
6 000 7 500 white-yellow |
weak Ca+ lines |
|
G |
4 900 6 000 yellow |
Ca+ lines metal lines |
|
K |
3 500 4 900 orange |
Ca+, Fe lines strong molecules CH, CN |
|
M |
< 3 500 red |
molecular lines eg TiO metal lines |
|
Many people use the mnemonic to help them: Oh Be
A
Fine
Girl
(Guy)
Kiss
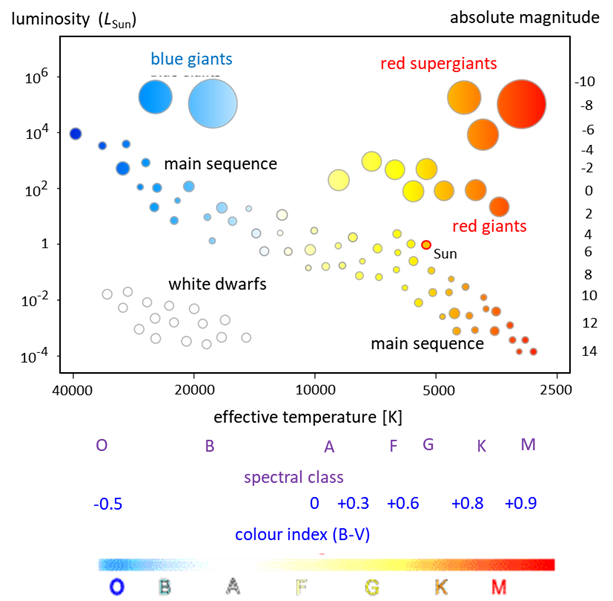
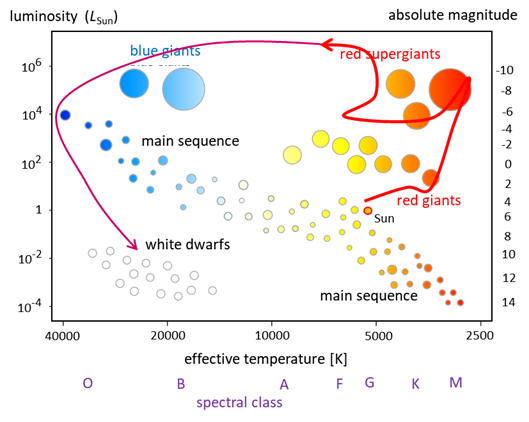
Me The Hertzsprung-Russell
diagram (HR diagram) is one of the most important tools in the
study of stellar evolution. Developed independently in the early 1900s by E.
Hertzsprung and H. Russell. For most stars, its colour is related to the
intrinsic luminosity and therefore to its mass. A useful way to present this
relationship is by the so-called HertzsprungRussell (HR) diagram. It plots
the temperature (colour - spectral type) of stars against their luminosity
(absolute magnitude).
Fig.
2. Hertzsprung-Russell (HR) diagram. Starting at the lower right we find the coolest
stars and by Wiens Displacement Law, their light output peaks at long
wavelengths, so they are reddish in colour. They are also the least luminous
and therefore of lowest mass. Farther up toward the left we find hotter and
more luminous stars that are whitish, like our Sun. Still farther up we find
even more luminous and more massive stars, bluish in colour. Stars that fall
on this diagonal band are called main-sequence stars. There are also stars
that fall outside the main sequence. Above and to the right we find extremely
large stars, with high luminosities but with low surface temperatures and
appear reddish in colour. These are called red giants. At the lower left,
there are a few stars of low luminosity but with high temperatures: these are
the white dwarfs. Depending on a stars initial mass, every star goes
through specific evolutionary stages dictated by its internal structure and
how it produces energy. Each of these stages corresponds to a change in the
temperature and luminosity of the star, which can be seen to move to
different regions on the HR diagram as it evolves. This reveals the true
power of the HR diagram astronomers can know a stars internal structure
and evolutionary stage simply by determining its position in the diagram. Three evolutionary stages shown
by the HR diagram 1.
Most stars, including our Sun, are found along a region called the Main Sequence.
Main Sequence stars vary widely in effective temperature but the hotter they
are, the more luminous they are. So, the main sequence stretches from the
upper left (hot, luminous stars) to the bottom right (cool, faint stars). It
is here that stars spend about 90% of their lives burning hydrogen into
helium in their cores. 2.
Red giant and supergiant stars occupy the region above the
main sequence. They have low surface temperatures and high luminosities
which, according to the Stefan-Boltzmann Law,
means they also have large radii. Stars enter this evolutionary stage once
they have exhausted the hydrogen fuel in their cores and have started to burn
helium and other heavier elements. 3.
White dwarf stars are
the final evolutionary stage of low to intermediate mass stars and are found
in the bottom left of the HR diagram. These stars are very hot but have low
luminosities due to their small size. The Sun is found on the main sequence with a
luminosity of 1 and a temperature of around 5400 K.
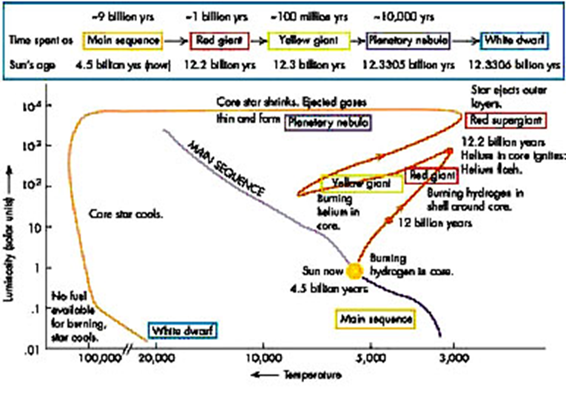
Fig.3. HR
diagram and the life cycles of starts Why do these three groups differ so much in luminosity? The answer to this question depends upon the
Stefan-Boltzmann relationship: The total power radiated from the surface of a
star increases with temperature Total power radiated from surface of
star (thermal radiation)
Pradiated [watts W] Stefan-Boltzmann constant s = 5.6705x10⁻⁸ W.m-2.K4 Emissivity of star surface e = 1 Surface area of star A [m2] Radius of star R [m] Surface temperature of star T [measured in kelvin K: T K = 273.15 + T oC] Hence,
If two stars have the same effective temperature but
one star is more luminous (greater power output) than the other, then, it
must have a larger radius and a greater surface area For stars of the same temperature, the more luminous ones are bigger |
|
Exercise 1 The intensity of the radiation from the Sun reaching
the Earth is known as the solar constant Estimate the
luminosity of the Sun given that the distance between the Sun and Earth is Solution The luminosity L of the Sun and the Solar constant |
|
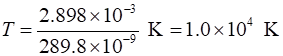
Exercise 2 A main sequence star has a peak wavelength in its
emission spectra of 289.8 nm. What band of the electromagnetic spectrum does the peak
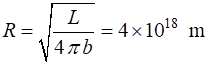
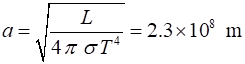
wavelength belong to? Estimate the surface temperature T of the star. It measured apparent brightness is b = 2.0x10⁻¹²
W.m-2. Estimate the distance R of the star from the Earth. Estimate the radius a of the star and compare its value with
the radius of the Sun. Hint: use the HR diagram (figure 1).
Stefan-Boltzmann constant
Radius of Sun
Solution Peak
wavelength Surface
temperature T of star From the HR
diagram: main sequence star with surface temperature 10 000 K, its luminosity
L is
approximately the same as our Sun The apparent
brightness b of the star
and its luminosity L
are connected by the equation Therefore,
the distance to the star R
[ m and light years ly ] is
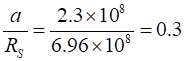
The luminosity L of the star is connected to its radius a Radius of
Sun So, the
radius of the star a
is smaller than the radius RS
of the Sun |
|
Why are there different types of stars? How is a star born? A star is born when gas clouds of mainly hydrogen
contract under the force of gravity. The mass of the cloud clusters into
globules causing an increase in the rate of contract and an increase in
kinetic energy of the gas molecules to form protostars.
Fig.4. Gas clouds contract due
to the gravitational force to create stars. When the kinetic energy of the gas molecules exceeds
the Coulomb repulsion between the molecules, nuclear fusion reactions occur.
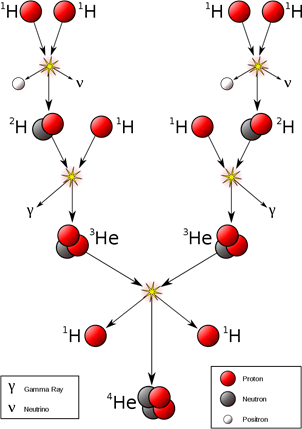
In our Sun, the burning of hydrogen occurs mainly via the proton-proton cycle in
which four protons fuse to form a helium nucleus with the release of gamma
rays and neutrinos. In a nuclear reaction, energy is either absorbed (endothermic / endoergic) to initiate the reaction or released (exothermic / exoergic) as kinetic energy of the particle
products and the energy of the electromagnetic radiation (gamma rays). The amount of energy absorbed or released
is called the Q-value (disintegration energy) where mass
defect Q-value
Q > 0 exothermic reaction: energy released Q < 0 endothermic reaction: energy
absorbed Proton-Proton Cycle 4 protons fuse to form helium in a
series of nuclear fusion reactions (view Appendix 1 and Practical Activity 1) Q1 = { (1.007825 +
1.007825) - (2.014102 + 5.489x10⁻⁴) }(931.5)
MeV Q1 = 0.42 MeV
(2) 1H1 + 2H1 Q2 ={ (1.00727645232093 + 2.01355319821093) - 3.01493216025186 }(931.5) MeV Q2 = 5.49 MeV (3)
3He2 + 3He2 Q3 = { (3.01493216025186 + 3.01493216025186) -(4.001506094311861 +
1.00727645232093 +1.00727645232093) }(931.5) MeV Q3 = 12.86 MeV The net result of
the proton-proton cycle is that four protons combine to form one 4He2
nucleus plus two positrons two neutrinos and two gamma rays (it takes two of
each of the first two reactions to produce the two 3He2
for the third reaction):
2(1H1 + 1H1)
2(1H1 + 2H1)
3He2
+ 3He2 (4) 4(1H1
)
By Borb, CC BY-SA 3.0,
https://commons.wikimedia.org/w/index.php?curid=680469 The total energy released for the net
reaction is 24.38 MeV. But, the two positrons (reaction 1) will quickly
annihilate with two electrons to release more energy 2(2mec2) = (4)( 5.4857990907x10⁻⁴)( 931.4940954) MeV = 2.04 MeV So, the
total energy released is 26.75 MeV.
Reaction 1
which produces the deuterium 2H1 has a very low
probability and thus occurs very infrequently and this limits the rate at
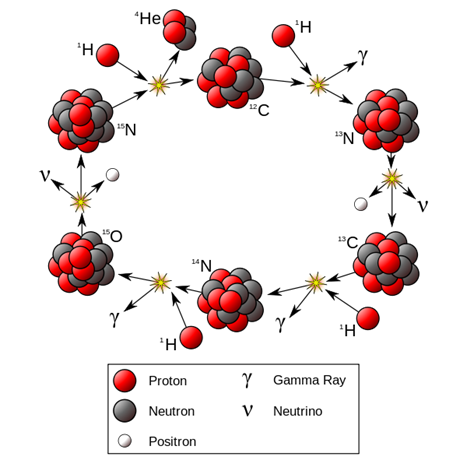
which the sun produces energy. CNO Cycle (Carbon-12 Cycle) In stars
that are more massive than the Sun, it is more likely that the energy output
comes principally from the CNO (carbon-12)
cycle. One possible sequence of the CNO cycle is
The two
positrons will annihilate with two electrons releasing a further 2.04 MeV.
so, the total energy released in the CNO cycle is 26.74 MeV. The theory
of the proton-proton cycle and the CNO cycle as the source of energy for
stars was first proposed by Hans Bethe in 1939. Both cycles involve the
transformation of four protons into a helium-4 nucleus. NUCLEAR FUSION So, the
energy source for stars is nuclear fusion which mainly involves the fusion of
four protons to form a helium-4 nucleus.
To accomplish nuclear fusion, the positively charged nuclei involved
must first overcome the electric repulsion to get close enough for the
attractive nuclear strong force to take over to fuse the particles. This
requires extremely high temperatures. We can do some simple computations to
estimate the kinetic energies of the particles and the temperature for fusion
to occur. What is the kinetic energy of a
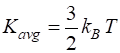
gas at room temperature (300 K) in J and MeV? The average
translation kinetic energy At 300
K Considering
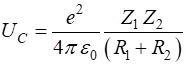
the Coulomb barrier UC due to the
electric repulsion to be the electric potential energy of two-point charges
(with atomic numbers Z1 and Z2 and with radii R1 and R2), then the
energy required to reach a separation The radius R of a nuclear is approximated by the
expression A is the mass number of the nucleus Hence, to
penetrate the Coulomb barrier in a head-on collision between two particles,
the required kinetic energy and the
temperature T of the
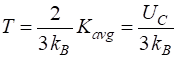
plasma (ionized gas) of the star is thus This value
for the temperature is an overestimate since we have used the average
temperature. In the plasma, many of the nuclei will be moving with energies
much greater than the average. The particles involved in the fusion process
have a wave nature and so can tunnel through
the barrier with an energy much lower than that given by the Coulomb barrier. Therefore,
the prerequisite for fusion is that the two nuclei be brought close enough
together for a long enough time for quantum tunnelling to act. What are the approximate energies
and temperatures required for nuclear fusion to occur in the proton-proton
cycle and the CNO cycle? Proton-proton cycle: fusion of two protons The energy
of a particle involved in a nuclear fusion reaction is about 10 000 000 times
greater than the energy of a gas molecule moving about at room temperature.
The energies involved in nuclear fusion reactions are enormous and this is why a star can shine for billions of years using
hydrogen as the fuel. CNO cycle: fusion of a carbon-12 nucleus and a
proton The required
energies and temperature for fusion to occur in the CNO cycle are much
greater than those for the proton-proton cycle. The nuclear
fusion in occurs only in the interior of stars because of the higher
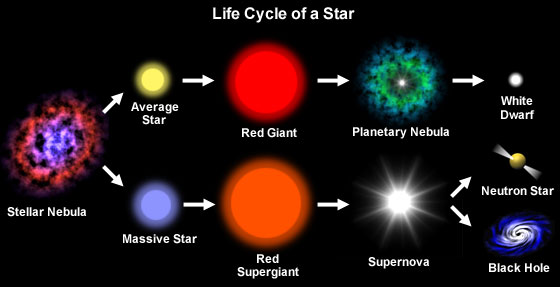
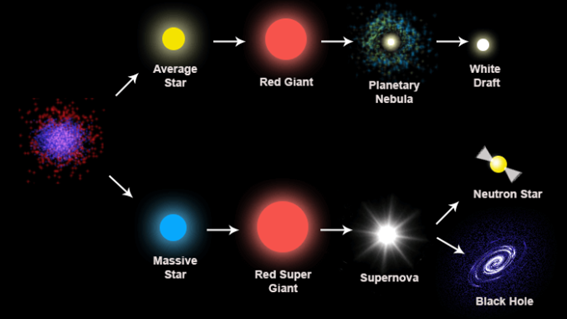
temperatures required to sustain fusion reaction. EVOLUTION OF STARS After the
formation of protostars, the tremendous release of energy in these nuclear
fusion reactions produces sufficient pressure to
stop the gravitational contraction and the protostar stabilizers to become a
young main sequence star. Exactly where the star sits on the main sequence
band in the HR diagram depends upon its mass. The more massive the star, the
further up and to the left it will be located on the HR diagram. From gas
cloud to young main sequence star takes about 30 million years (3x10⁷
y). Stars such as our Sun will remain as a main sequence star for about 10
billion years (1010 y). At the core
of the star, the hydrogen fuel is consumed, and a shell of helium is formed
surrounding it. When much of the hydrogen is consumed within the core, the
production of energy decreases, and the gas pressure is no longer sufficient to prevent the huge gravitational forces from
once again causing the star to contract and the core to heat up. The hydrogen
in the shell now burns (burn refers to high temperature nuclear fusion
reactions and must not be confused with ordinary burning in air which is are chemical
reactions) fiercely producing a rise in temperature which results in an
expansion of the outer envelope of the star. The expansion of the nonburning
envelop cools and the surface temperature of the star is reduced and produces
a spectrum which has peaks at longer wavelengths. The star becomes redder,
bigger and more luminous as it leaves the band of main sequence stars. So,
the star will move to the right and upward on the HR diagram and enter the red giant stage.
Fig.5.
Red giant star Our Sun has
been a main sequence star for about 4.5x10⁹ y and most likely
remain as a main sequence star for another 5x10⁹ y. When our Sun
leaves the main sequence, it is expected to grow in size
as a red giant until it occupies the volume out to approximately the size of
the Earths orbit. So, no need to worry about our Sun becoming a red giant
star any time soon.
Fig. 6. Our
Sun (main sequence star: surface temperature ~ 5800 K.
Fig. 7. HR
diagram showing the evolutionary path of a typical star such as our Sun. As the
stars envelope expands, the core is shrinking and heating up. When the core
temperature reaches about 108 K, even helium nuclei with their
greater charge and hence greater electrical repulsion can undergo fusion. The
fusion of three helium-4 nuclei produces the isotope carbon-12 The first
reaction is slightly endothermic and the 8Be4 nuclei is
unstable and can decay back into two alpha particles within 10-16 s. So, the second reaction must occur very
quickly after the first reaction for carbon-12 to be produced. This burning
of helium causes major changes in the star, and the star now moves rapidly
along the horizontal branch of the HR diagram. For stars with a mass greater
than about 0.7 solar masses, as its core temperature increases nuclei as
heavy as 56Fe26 and 56Ni28 can be
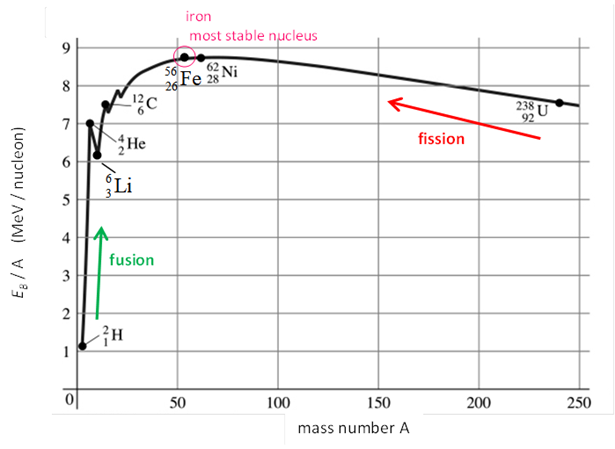
produced within the star. Here, the process of nucleosynthesis where heavy nuclei are formed by the
fusion of lighter ones ends since the average binding energy per nucleon
begins to decrease for A
greater than about 60.
Fig. 8.
Binding energy per nucleon plot. Fusion reactions are exothermic for A < 60. For stars
with a mass less than 1.4 solar masses (Chandrasekhar
limit), no further fusion can take place and the star collapses under the
action of gravity to become a white dwarf star (on
the HR diagram the trajectory is from the upper left downward). A star such
as our Sun will shrink to a about the size of the Earth. The white dwarf
halts its collapse due to the repulsion between electron clouds (Pauli
Exclusion Principle). The white dwarf star will continuous to lose energy,
hence decreasing its temperature as it becomes dimmer and dimmer until its
lights go out. The result is a black dwarf which is
just a chunk of dark cold ash. Massive
stars (mass greater than 1.4
solar masses) follow a very different scenario. Gravity is so
strong, contraction can continue resulting in extremely high core temperatures
and pressure, so that fusion can continue to produce elements heavier than
iron and collisions between nuclei can result in the destruction of heavy
nuclei to form alpha particles, protons and neutrons. The
temperatures and pressures can become so greater that an energy-requiring
endothermic reaction can force electrons and protons to from neutrons
(inverse e- + p+ We end up
with an enormous nucleus made up of almost exclusively of neutrons. The size
of the star is no longer limited by the Pauli Exclusion Principle applied to
electrons, but rather applied to neutrons. The star then contracts rapidly to
form an enormously dense neutron star. As the contraction continues to form the
final core of the neutron star, a catastrophic explosion may occur where the
entire outer envelope of the star is blow away, spreading its contents into
the surrounding interstellar space. In this explosion it is believed that
virtually all the elements of the periodic table are created. This explosion
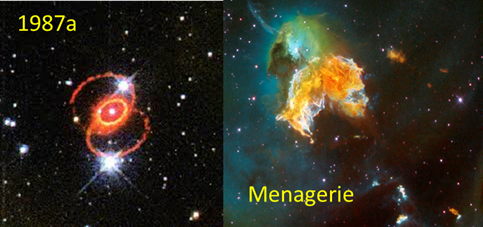
is observed as a supernova.
In a supernova explosion, a stars brightness is observed to suddenly
increase billions of times in a period of just a few days and then fade away
over a few months. Examples of
supernova events observed with the naked eye include:
Feb 1987 in the Large Magellanic Cloud, 170 000 ly
away.
1604 observed by Kepler and Galileo
1054 observed by Chinese astronomers and
some of the remains as still visible in the Crab Nebula. In the midst is a pulsar (rotating neutron star that emits sharp pulses
of electromagnetic radio at regular intervals). The core of
a neutron star contracts to a point at which all neutrons are close together
as they are in a nucleus (density ~ 1014x density of materials of
Earth). A neutron star that has a mass of 1.5 solar masses would have a
diameter of only 10 km.
Fig. 9. Supernova remnants If the mass
of the star is greater than about 3 solar masses, the gravitational force
may force further contraction to even smaller diameters and ever-increasing
density, the force is so great that even the neutron Pauli Exclusion
Principle can be overcome. Gravity is now so strong that light cannot escape
(the escape velocity is greater than the speed of light). We now have a black hole. Since, no radiation can escape form the black hole,
it would appear black. Black holes can be detector by observing the
deflection of radiation passing not to near the black hole. If the radiation
came too close, then it would be swallowed up, never to escape. There may be
a black hole at the centre of our galaxy and its estimated mass is several
million solar masses.
Fig. 9. Evolutionary path of a
star depends upon its initial mass. |
|
PRACTICAL ACTIVITY 1 Q-value calculations Doing calculation on nuclear reactions using a
calculator is very tedious. A better way to do such calculations is to use a
spreadsheet or write a Matlab Script. Use
Matlab or a spreadsheet to calculate all the Q-values that are given in the notes
above. Values for the numerical data is given in Appendix 1. |
|
PRACTICAL ACTIVITY 2 LIFETIME OF OUR SUN
We can do an amazing calculation to
estimate the lifetime of our Sun. Only the core of the Sun is hotter enough for
nuclear fusion to occur via the proton-proton cycle. So, we can estimate the
amount of available energy from the Suns core to sustain the Sun over its
lifetime using the following numerical data. Average
density of Suns core Mass of a proton Radius of Sun Radius of Suns core Q-value for proton-proton cycle
Sun-Earth distance Solar constant (solar radiation reaching
Earth) Proportion of core hot enough to sustain
nuclear fusion We can now calculate the following: Energy output of the Sun per year Radius of core Volume of Suns core Mass of Suns Core Number of protons in Suns core Available energy from core by fusion of
4 protons to give helium Lifetime of Sun in years
To see how all the calculations
were done, inspect the Matlab Script %% ENERGY OUTPUT OF SUN
============================================= format short % Mass of proton [kg] mP = 1.672623e-27; % Average density of core [kg/m^3] d_core = 1.5e5; % Radius of Sun [m] R_sun = 6.96e8; % Distance Sun - Earth [m] R_SE =
1.496e11; % Q-value for proton-proton cycle [J] Q_pp = 25*e*1e6; % Power out of Sun [W] P_sun = 3.846e26; % Solar constant [W.m^2] S0 =
1.368e3; % Proportion of core hot enough to sustain nuclear
fusion eta = 0.10; % Radius of core [m] R_core = 0.25 * R_sun; % Volume of core [m^3] V_core = (4/3)*pi*R_core^3; % Mass of core [kg] M_core = d_core * V_core; % Number of protons in core N_core = M_core / mP; % Available energy from core by fusion of 4 protons
to give helium [J] Q_core = eta * (N_core/4) * Q_pp % Energy output from Sun in one year [J} E_sun = P_sun *(3600*24*365) % Power output of sun from Solar Constant [W] P_solar = S0 * (4*pi*R_SE^2) % Energy output of Sun from Solar Constant S_sun [J] E_solar = S0 * (4*pi*R_SE^2) * (3600*24*365) % Lifetime of Sun [years] LifeTime = Q_core / E_sun
The results of the computation are: Qcore = 1.98x1044 J ESun = 1.21x1034 J/y LifeTime = 1.6x10¹⁰ y We get a remarkable result for such a simple
computation. The Sun can radiate energy for 1010 years as a
main sequence star. The fusion of four protons to form helium does not
release much energy, but when you consider the tremendous number of protons
that can undergo fusion, the Suns lifetime is very long and is in the order
of 10 billion years. |
|
APPENDIX 1 NUMERICAL DATA Atomic masses for the elements can be
found at https://wwwndc.jaea.go.jp/NuC/ The element masses shown are nuclei
masses and not the masses of the corresponding neutral atom. 1 u = 931.4940954 MeV/c2 electron me = 5.4857990907x10⁻⁴ u proton mP = m(1H1) = 1.00727645232093 u deuterium m(2H1) = 2.01355319821093 u helium-3 m(3He2) = 3.01493216025186 u helium-4 m(4He2) = 4.001506094311861 u beryllium m(8Be4)
= 8.00311078236372 u carbon m(12C6) = 11.99670852054558 u m(13C6) = 13.00006335561558 u nitrogen m(13N7) = 13.001898549636509 u m(14N7) = 13.999233945066509 u m(15N7) = 14.99626883951651 u oxygen m(15N08) = 14.99867697872744 u |
|
APPENDIX 2 MATLAB Every teacher and student of physics should be using
Matlab. A Matlab Script mpNuclear.m for calculating mass defects, Q-values for
nuclear reactions and other nuclear calculations can be downloaded from http://www.physics.usyd.edu.au/teach_res/mp/mscripts/ View Nuclear Physics Calculations Made
Simple A section of the Script is shown below. Work through
the Script so that you know how various physical quantities were calculated.
Knowing how write a computer program to compute something is a great way to
improve your understanding of physical phenomena. Section of Script for calculating binding energies
and binding energies per nucleon % INPUTS
============================================================== % Input atomic number Z and mass number Z of isotope of
element Z = 36; A = 92; %
===================================================================== % Number of protons nP
= Z; % Number of neutrons nN
= A-Z; % Mass of nucleus of isotope [u] mNuc
= mass(Z,A); % Mass of nucleons (protons + neutrons) [u] mPN
= nP*mp + nN*mn; % Mass Defect [u] dm = mNuc
- mPN; % Q-value [MeV] (amu --> MeV) Q = u_MeV
* dm; % Binding Energy [MeV] EB = -Q; % Binding Energy / nucleon [MeV / nucleon] EB_A = EB/A; Section of Script for calculating Q-value for a
nuclear reaction % INPUT =============================================================== %
Reactants (Initial state) mReactants = mass(1,2) + mass(1,3) ; %
Products (Final State) mProducts = mass(2,4) + mn; %
====================================================================== % Mass defect [u] dM = mReactants - mProducts; %
Q-value for nuclear reaction [MeV] % Q > 0 exoenergetic
reaction: energy released % Q < 0 endoenergetic
reaction: energy absorbed Q = dM * u_MeV; What nuclear reaction
does this calculation correspond to? |
|
If you have any feedback, comments, suggestions or
corrections please email: Ian Cooper
School of Physics University
of Sydney ian.cooper@sydney.edu.au |